A Dataset of in situ SPAD Readings and in vitro Chlorophyll Concentration Analyses from Quercus variabilis Bl. in Mt. Funiu, China
Wang, Z. X.* Li, F.
State Key Lab of Resources and Environmental Information System, Institute of Geographic Sciences and Natural Resources Research, Chinese Academy of Sciences, Beijing 100101, China
Abstract: Chlorophyll concentration (Chl) in plant leaves is a key indicator for monitoring plant health and dynamics, but direct chlorophyll concentration measuring (Chl) in laboratory (in vitro) is both expensive and laborious, which makes it prohibitive to conduct large scale Chl studies. An alternative approach is to develop a statistical relationship by measuring optical readings in field (in situ) and meanwhile measuring Chl in laboratory (in vitro). This dataset consists of three parts for a type of oak tree (Quercus variabilis Bl.), a dominant species in Mt. Funiu, Henan province, China. The first part is in situ SPAD readings in oak leaves, an optical measure with Minolta SPAD-502 meter, while the second part is in vitro chlorophyll concentration measurement (Chl) of the same oak leaves, with a two-step extraction and determination method for chlorophyll presented by Qiu et al. (2016). Totally, there were 31 samples for in situ SPAD readings, and 93 measurements for in vitro Chl (three Chl repeats for each SPAD). Finally, these 93 SPAD-Chl pairs data were used to develop various statistical relationships and the best-fit correlation was an exponential correlation (Chl (µ??/cm2) = 8.712e0.035×SPAD), with R2= 0.927. This dataset is consisted of three files, with the data size of 31.6 KB.
Keywords: chlorophyll concentration; SPAD; in situ; in vitro; relationship; oak; Quercus variabilis Bl.
1 Introduction
Chlorophyll concentration (Chl) in plant leaves is a key indicator for monitoring plant health, but direct chlorophyll concentration measuring (Chl) in laboratory (in vitro) is both time- and labor-intensive, which makes it less applicable to large scale Chl studies. An alternative approach is to develop a statistical equation by measuring optical readings in the field (in situ) and meanwhile measuring Chl in the laboratory (in vitro).
SPAD-502 is one of the optical chlorophyll meters and its reading is a unitless number between 0 and 100[1]. The earliest literature of SPAD application in China came into being in 1991[2], and many publications followed covering diverse plants from crops to vegetables, mostly in the field of intensive agriculture. However, the application of SPAD to forest study came relatively late and rare. The first literature about SPAD application in forest did not appear until 2005[3]. Trees from Fagaceae dominate most of forests and distributed very broadly in China (with an area of 161,271 km2, accounting for 9.80% of the forest in China), but the study on these trees based on SPAD is just started recently and focuses on Northeast China[4–6]. The present dataset is the first case on SPAD-Chl of Fagaceae trees in middle of China.
2 Metadata of Dataset
Table 1 shows the metadata summary for the dataset of in situ SPAD readings, in vitro chlorophyll concentration measuring, and their relationship: Quercus variabilis Bl. in Mt. Funiu, China[7].
Table 1 Metadata summary of the dataset of in situ SPAD readings, in vitro chlorophyll concentration measuring, and their relationship: Quercus variabilis Bl. in Mt. Funiu, China
|
Items
|
Description
|
|
Dataset full name
|
Dataset of in situ SPAD readings, in vitro chlorophyll concentration measuring, and their relationship: Quercus variabilis Bl. in Mt. Funiu, China
|
|
Dataset short name
|
Chlorophyll_Quercus variabilis Bl._Mt.Funiu
|
|
Authors
|
Wang, Z. X. L-5255-2016, Institute of Geographic Sciences and Natural Resources Research, Chinese Academy of Sciences, wangzx@igsnrr.ac.cn
Li, F. L-3424-2018, Institute of Geographic Sciences and Natural Resources Research, Chinese Academy of Sciences, lif@igsnrr.ac.cn
|
|
Geographic region
|
Luanchuan county, Henan province (in Mt. Funiu region), 33°52′34.16″N, 111°45′10.79″E
|
|
Sampling date
|
September 19, 2018
|
|
Data format
|
.shp, .kmz, .xlsx
|
|
Data size
|
31.6 KB (28.4 KB after compression)
|
|
Data files
|
(1) Site location: 1.shp file, 1 .kml file; (2) SPAD and Chlorophyll measurements: 1 .xlsx file
|
|
Foundation
|
Ministry of Science and Technology of P. R. China (2016YFA0600201)
|
|
Data publisher
|
Global Change Research Data Publishing & Repository, http://www.geodoi.ac.cn
|
|
Address
|
No. 11A, Datun Road, Chaoyang District, Beijing 100101, China
|
|
Data sharing policy
|
Data from the Global Change Research Data Publishing & Repository includes metadata, datasets (data products), and publications (in this case, in the Journal of Global Change Data & Discovery). Data sharing policy includes: (1) Data are openly available and can be free downloaded via the Internet; (2) End users are encouraged to use Data subject to citation; (3) Users, who are by definition also value-added service providers, are welcome to redistribute Data subject to written permission from the GCdataPR Editorial Office and the issuance of a Data redistribution license; and (4) If Data are used to compile new datasets, the ‘ten percent principal’ should be followed such that Data records utilized should not surpass 10% of the new dataset contents, while sources should be clearly noted in suitable places in the new dataset[8]
|
3 Methods
3.1 In Situ Sampling and Optical Measurement of Leaf Chlorophyll: SPAD
(1) Site and Date of sampling: The oak leaf sampling was conducted nearby the New South Village Reservoir, Luanchuan county, Henan province (in Mt. Funiu region), on September 19, 2018 (Table 1). It should be made clear that the purpose of this sampling is to build a SPAD-Chl relationship; therefore, an ideal sampling is to collect as diverse leaves as possible for oak. Once leaves leaving crown, the rest of processing of leaves should be conducted in shade to minimize the exposure of leaves under sunshine.
(2) Pre-processing of leaves: Leaves were rinsed with tap water to clean dust.
(3) Ranking and classification: Rank all leaves according to greenness, and classify them into 31 groups (samples). Each sample consists of 4-6 leaves.
(4) Measurement of SPAD: Each leaf was measured at ten locations (except midrib) using SPAD-502 meter. The leaves with large SPAD deviation from group average (>1.5) were reclassified into relevant groups. After adjustments, we got 31 in situ samples.
3.2 Preservation of Samples
The key to preserve the freshness of leaf is to keep it in dark, in low temperature, and wet. It is ideal to use liquid nitrogen or dry ice, but both are constrained materials due to their high volatility. After trials and errors, we used wet ice to reserve the samples: wrap plastic sample bag with wet towel; and wrap wet ice (small bottle) with dry towels to prevent frost resulted from direct contact of leaves and ice. It took three hours to send samples (Luanchuan, Henan) to the laboratory in Henan University of Science and Technology (Luoyang, Henan).
3.3 In Vitro Measurement of Absolute Leaf Chlorophyll Concentration: Chl
(1) Unit of Chl: Leaf Chlorophyll concentration (Chl) can be represented on a mass basis (µg/g), or on an area basis (µg/cm2). While the former still dominates the literature in Chinese journals, we chose the latter for its two merits: area-based Chl can minimize the uncertainties resulted from moisture changes after leaves’ departure from crown[9]; and area-based Chl can be directly integrated with Leaf Area Index (LAI, cm2/cm2) to facilitate large scale Chl research.
(2) Collection of Chl Samples: A puncher with 9 mm in diameter was used to collect discs in the same location of sample leaves. The number of discs was determined according to pre-set sample mass (0.05 g).
(3) Pigment extraction and quantification: Although it is fundamental, there is no standard procedure to extract and quantify Chl. Here we chose the two-step extraction method presented by Qiu et al.[10]. First, the discs (or filaments) were dropped into 2 mL DMSO in 65 oC until became white or transparent; then, 8 mL 80% acetone was added to cooled DMSO. Some samples may be further diluted to meet the requirement of spectrophotometer. The absorbance of the extract was measured with spectrophotometer, and the Chl was calculated using following formulas:
Chla (mg/L)=12.27A663.6 −2.52A646.6 (1)
Chlb (mg/L)=20.10A646.6 − 4.92A663.6 (2)
Chl (mg/L)=Chla+Chlb=7.35A663.6+17.58A646.6 (3)
where Chl (mg/L) is the leaf chlorophyll concentration, A663.6 and A646.6 are absorbance of the extract in 663.6 nm and 646.6 nm, respectively. Chl (mg/L) can be transformed into Chl (µg/cm2) using discs area and dilution data. There are 3 in vitro analysis repeats for each in situ sample, thus there are totally 93 SPAD-Chl pairs.
3.4 Statistical Analysis
Four types of regression equations were developed based on 93 SPAD-Chl pairs, the best-fit regression equation was chosen according to the Coefficient of Determination (R2).
4 Results and Validation
The published dataset[7] consists of three files: one file in excel format (in situ optical measurements, SPAD; and in vitro absolute measurement, Chl); two files in .shp and .kml format, respectively (location of sampling). A brief analysis is as follows.
4.1 Basic Characteristics of Optical SPAD and Absolute Chl
Table 2 Statistics of SPAD and chlorophyll
|
Parameter
|
Statistics indexes
|
|
Samples
|
Minimum
|
Maximum
|
Mean
|
Median
|
Stdev
|
CV (%)
|
|
SPAD (unitless)
|
31
|
10.6
|
56.6
|
41.84
|
45.5
|
12.23
|
29.23
|
|
Chl (µg/cm2)
|
93
|
8.64
|
72.17
|
42.63
|
42.77
|
15.84
|
37.16
|
According to Table 2, SPAD ranges from 10.6 to 56.6, with an average of 41.84; and Chl ranges from 8.64 to 72.17 µg/cm2, larger than SPAD. Meanwhile, Coefficient of Variation (CV%) of Chl is also bigger than SPAD. Two factors may explain Chl’s bigger CV%: the data range itself is bigger; there is a large uncertainty of Chl measurement because more factors involved.
4.2 Relationships between SPAD and Chl
Correlation relationships of SPAD and Chl were analyzed and four types of regression models were developed (Table 3). According to Coefficient of Determination (R2), the best-fit of SPAD-Chl for total chlorophyll goes to exponential regressive model, with a R2 of 0.927. Within Chl, the SPAD-Chl relationship for chlorophyll a (Chla) is better than that for chlorophyll b (Figure 1).
Table 3 Relationships between SPAD and Chl for Oak (Quercus variabilis Bl.)
|
Chlorophyll
|
y=ax+b
|
y=axb
|
y=aebx
|
y=aln(x)+b
|
|
Chla
|
y = 0.903x-8.852
R² = 0.862
|
y = 0.265x1.246
R² = 0.914
|
y = 3.815e0.045x
R² = 0.948
|
y = 23.04ln(x)-55.46
R² = 0.719
|
|
Chlb
|
y = 0.274x+2.197
R² = 0.661
|
y = 1.626x0.568
R² = 0.621
|
y = 5.146e0.022x
R² = 0.741
|
y = 6.759ln(x)-11.07
R² = 0.514
|
|
Chla+Chlb
|
y = 1.177x-6.653
R² = 0.826
|
y = 1.150x0.962
R² = 0.856
|
y = 8.712e0.035x
R² = 0.927
|
y =29.80ln(x)-66.53
R² = 0.678
|
x = SPAD (unitless); y = Chl (µg/cm2 )
4.3 Relationship of Chlorophyll Concentration and Chla/Chlb Ratio
Both Chlorophyll concentration and Chlorophyll a/Chlorophyll b ratio (Chla/Chlb) can be used as indicators of leaf health status. Figure 2(a) illustrates the relationship between chlorophyll concentration (Chl, µg/cm2) and Chla/Chlb ratio: when Chl is bigger than 30 µg/cm2, there is a broad and relatively stable plateau for Chla/Chlb ratio; while when Chl is less than 30 µg/cm2, there is a linear relationship between Chl and Chla/Chlb ratio.
Figure 2(b) shows the relationship between SPAD and Chla/Chlb ratio: when SPAD is bigger than 35, there is a relatively stable plateau for Chla/Chlb ratio; while when SPAD is less than 35, there is a linear relationship between Chl and Chla/Chlb ratio. The prominent difference between SPAD and Chl occurs when Chla/Chlb ratio is bigger than 2. Under this situation, a small change in SPAD may represent a relatively large change in Chl, indicating the accuracy of in situ SPAD measurement.
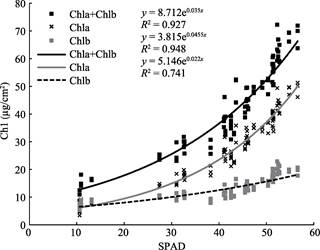
Figure 1 Exponential regression between SPAD and Chl for Oak
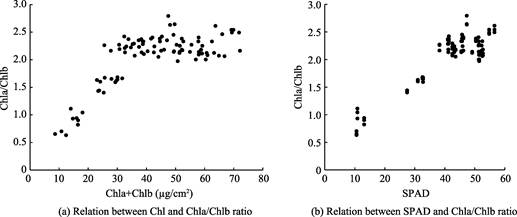
Figure 2 Relationship of Chlorophyll concentration and Chla/Chlb ratio for Oak
4.4 Validation and Accuracy Assessment
The design of the SPAD meter is based on the principle that increased leaf Chl increases the absorption of red and all leaves transmit a high fraction of NIR, thus theoretically, SPAD-Chl relationship can be regarded as a cause-effect relationship. The exponential regressive model is the best SPAD-Chl equation in terms of Coefficient of Determination (R2), with a R2 of 0.927, which means SPAD can determine 92.7% of the variance of Chl.
5 Discussion and Conclusion
(1) Reliability and Applicability of SPAD-Chl relationship: The SPAD-Chl relationship based on samples on September 19, 2018 in Mt. Funiu can be used to predict chlorophyll concentration (Chl) using SPAD readings, in this season and for this region at least, with a high confidence. Further study is on schedule to explore its broader applicability.
(2) Integration and inter-comparison of oak SPAD-Chl with other models: The oak SPAD-Chl model may be used for comparative studies among various plants[11]. In this respect, the digital publication of both in situ SPAD and in vitro Chl data offers a better opportunity.
(3) Refinement of SPAD-Chl Equation: The present SPAD-Chl equation may be modified in two aspects. First, for in situ sampling and SPAD measurement, one-leaf-one-sample may be better than many-leaf-one-sample, because there are variances among leaves in one sample and not every leaf is used for in vitro measurement. Second, when getting discs with puncher, a smaller puncher (5-6 mm in diameter) will offer more chances to keep the consistency between SPAD location and punching location in a leaf.
Author Contributions
Wang, Z. X. designed the development of dataset and wrote the data paper. Li, F. was responsible for in situ sampling, SPAD measurement, and sample preservation.
Acknowledgements
We thank Dr. Zeng, Z. K. and Dr. Wang, Z. H., Henan University of Science and Technology, for their assistance in chlorophyll analysis.
References
[1] Minolta Camera Co. Ltd. Chlorophyll Meter SPAD-502 Instructional Manual [M]. Minolta, Osaka, Japan,1989.
[2] Zhang, W. A. The application of SPAD-501 chlorophyll analyzer to determine the chlorophyll contents in rice [J]. Journal of Guizhou Agricultural Sciences, 1991(4): 37-40.
[3] Jiang, L. F., Shi, F. C., Wang, H. T., et al. Application tryout of chlorophyll meter SPAD-502 in forestry [J]. Chinese Journal of Ecology, 2005, 24(12): 1543-1548. DOI: 10.13292/j.1000-4890.2005.0197.
[4] Liu, X. L., He, Y. Z., Yu, T. H., et al. Correlation analysis on SPAD values and chlorophyll content of oak leaf [J]. North Sericulture, 2016, 37(4): 16-19, 24.
[5] Li, G. Y. The relationship between chlorophyll and SPAD and the related factors for major broadleaved tree species in northeast China [D]. Harbin: Northeast Forestry University, 2016.
[6] Li, T., Han, X., Wei, Y. Y., et al. Correlation analysis on SPAD values and chlorophyll content of for three varieties of Chinese chestnut (Castanea mollissima Blume) [J]. Shandong Forestry Science and Technology. 2017(1): 23-27.
[7] Wang, Z. X., Li, F. Dataset of in situ SPAD readings, in vitro chlorophyll concentration measuring, and their relationship: Quercus variabilis Bl. in Mt. Funiu, China [DB/OL]. Global Change Research Data Publishing & Repository, 2018. DOI: 10.3974/geodb.2018.07.16.V1.
[8] GCdataPR Editorial Office. GCdataPR data sharing policy. DOI: 10.3974/dp.policy.2014.05 (Updated 2017).
[9] Xu, D. Q. Several problems in measurement and application of chlorophyll content [J]. Plant physiology communications, 2009, 45(9): 896-898.
[10] Qiu, N. W., Wang, X. S., Yang, F. B., et al. Fast extraction and precise determination of chlorophyll [J]. Chinese Bulletin of Botany, 2016, 51(5): 667–678.
[11] Parry, C., Blonquist, J. M., Bugbee, B. In situ measurement of leaf chlorophyll concentration: analysis of the optical/absolute relationship [J]. Plant, Cell and Environment, 2014, 37(11): 2508–2520. DOI: 10.1111/pce.12324.