Monthly Iceberg Calving Dataset of the Antarctic
Ice Shelves (2010-2019)
Qi, M. Z.1,3,4 Liu, Y.1,3,4 Cheng, X.2,3,4* Feng, Q. Y.1 Lin, Y. J.1,4 Wei, Y.1,3,4 Yang,
C.1,3,4 Hui, F. M.2,3,4
Chen, Z. Q.2,3,4 Li, X. Q.2,3,4 Zhang, Y. Y.1,3,4
Zhang, Y.1,3,4
Chen, X. T.1,4 Liu, A. B.1,3,4 Chen, Y. T.1,3,4 Guan, Z. F.1,4 Ye, Y.1,4 Shang, X. Y.1,3,4 Tian, J. H.1,3,4 Duan, M. H.1,4 Zhang, Z. Y.1,3,4
1. State Key Laboratory of Remote Sensing Science, and
College of Global Change and Earth System Science, Beijing Normal University,
Beijing 100875, China;
2. School of Geospatial Engineering and Science, Sun
Yat-Sen University, Zhuhai 519082, China;
3. Southern Marine Science and Engineering Guangdong
Laboratory, Zhuhai 519082, China;
4. University Corporation for Polar Research, Beijing
100875, China
Abstract: Iceberg calving
is a major process of Antarctic mass loss, and it has been regarded as a
crucial variable in precisely evaluating the mass balance of ice shelves. We
used multi-source remote sensing data from the first three days of each month
from August 2010 to August 2019, including ENVISAT ASAR (WSM) images from
August 2010 to April 2012, Terra/Aqua MODIS 7-2-1 band composite images from
January 2012 to December 2014 (except during polar night), Landsat-8 OLI 4-3-2
band composite images from October 2013 to August 2019 (except during polar
night), and Sentinel-1 SAR (EW) images from October 2014 to August 2019, to
generate monthly mosaics of the Antarctic coastline. Then, combining the image data
with the annual iceberg calving dataset, we extracted all monthly calving
events that occurred between August 2010 and August 2019 through vector
segmentation and calculated the area, thickness, mass, and calving period
through spatial computing. The monthly iceberg calving dataset of the Antarctic
ice shelves, which were classified by month (12 monthly datasets and one polar
night dataset), contains the distribution of each monthly calving event, along
with the calving year, calving month, length, area, thickness, mass, calving
period, and calving type. This dataset is archived in .shp format and consists
of 104 data files with a data size of 4.3 MB (compressed to one file, 1.6 MB).
Keywords: Antarctica; ice shelves; iceberg calving; remote sensing; 2010?C2019
Dataset Availability Statement:
The dataset supporting
this paper was published and is accessible through the Digital Journal of Global
Change Data Repository at:
https://doi.org/10.3974/geodb 2020.04.13.V1.
1 Introduction
Iceberg calving, the shedding of ice from an ice shelf or
the frontal edge of a glacier into the ocean, is one of the main processes of
Antarctic ice mass loss[1-3]. Observations of individual calving events with
high spatial and temporal resolution are important in optimizing existing ice
sheet models[4-5], further studying the triggering mechanisms of calving[6],
and better understanding the behaviours of glaciers and ice sheets[7].
Monitoring individual calving events at the continental scale month by month is
time-consuming and laborious; therefore, current studies of Antarctic iceberg
calving have focused more on small scales or specific ice shelves[8-9], and there is still a lack of high-precision
monitoring of monthly calving events over long periods.
Based
on the annual iceberg calving product and multisource satellite imagery of the
Antarctic ice shelves[10], this
dataset was developed after artificial interpretation and spatial editing. This
dataset contains attributes of each monthly calving event from August 2010 to
August 2019, including their locations, outlines, years of occurrence, months of occurrence, areas, thicknesses, masses, cycles,
and types. The minimum extracted area of calving is approximately 0.02 km2,
and the temporal resolution is monthly. The monthly iceberg calving dataset can
be used not only to reflect the local details of monthly iceberg calving but
also as a basis for spatial analysis of seasonal patterns of calving at
different scales.
2 Metadata
of the Dataset
The metadata of the ??Monthly iceberg calving
dataset of the Antarctic ice shelves (2010-2019)??[11] are shown in Table 1.
Table 1 Metadata summary of the
??Monthly iceberg calving dataset of the Antarctic ice shelves (2010-2019)??
|
Items
|
Description
|
|
Dataset full name
|
Monthly iceberg calving dataset
of the Antarctic ice shelves (2010-2019)
|
|
Dataset short name
|
MonthlyIcebergCalvingAntarctic_2010-2019 Authors As
shown in Table 2
|
|
Geographical region
|
Antarctica
Year From August 2010
to August 2019
|
|
Temporal
resolution
|
1 month Spatial
resolution 0.02 km2
|
|
Data
format
|
.shp
|
|
Data
size
|
4.3
MB (compresses to one file, 1.6 MB)
|
|
Data
files
|
This dataset provides monthly calving events occurring across
the Antarctic ice shelf over nine consecutive
years and consists of 12 monthly iceberg calving sub-datasets and one polar
night calving sub-dataset, with each subset named by the month (or polar
night). The subset contains information on the specific years in which the
monthly disintegrations occurred, as shown in Table 3
|
|
Foundations
|
Ministry
of Science and Technology of P. R. China (2018YFA0605403); National Natural
Science Foundation of China (41925027)
|
|
Data
publisher
|
Global
Change Scientific Research Data Publishing System, http://www.geodoi.ac.cn
|
|
Address
|
11A,
Datun Road, Chaoyang District, Beijing 100101, China
|
|
Data
sharing policy
|
Data from the Global Change
Research Data Publishing &Repository includes metadata, datasets (in the Digital Journal of Global Change Data Repository), and
publications (in the Journal of Global Change Data & Discovery). Data
sharing policy includes: (1) Data are openly available
and can be free downloaded via the Internet; (2) End users are encouraged to
use Data subject to citation; (3) Users, who are by definition
also value-added service providers, are welcome to redistribute Data subject
to written permission from the GCdataPR Editorial Office and the issuance of
a Data redistribution license; and (4) If Data are
used to compile new datasets, the ??ten per cent principal?? should be followed
such that Data records utilized should not surpass 10% of the
new dataset contents, while sources should be clearly noted in suitable
places in the new dataset[12]
|
|
Communication and searchable system
|
DOI, DCI, CSCD, WDS/ISC, GEOSS, China GEOSS, Crossref
|
Table 2 Authors?? information on the dataset
|
No.
|
Name
|
Research ID
|
Department
|
E-mail
|
|
1
|
Qi, M. Z.
|
AAT-5417-2020
|
College of Global Change and Earth System Science, Beijing
Normal University
|
201921490035@mail.bnu.edu.cn
|
|
2
|
Liu,
Y.
|
AAT-5481-2020
|
College of Global Change and Earth System Science, Beijing
Normal University
|
liuyan2013@bnu.edu.cn
|
|
3
|
Cheng,
X.
|
AAT-6307-2020
|
School of Geospatial Engineering and Science, Sun Yat-Sen
University
|
chengxiao9@mail.sysu.edu.cn
|
|
4
|
Feng,
Q. Y.
|
AAT-5443-2020
|
College of Global Change and Earth System Science, Beijing
Normal University
|
306592082@qq.com
|
|
5
|
Lin,
Y. J.
|
AAT-6421-2020
|
College of Global Change and Earth System Science, Beijing
Normal University
|
201921490033@mail.bnu.edu.cn
|
|
6
|
Wei,
Y.
|
AAT-5411-2020
|
College of Global Change and Earth System Science, Beijing
Normal University
|
201721490021@mail.bnu.edu.cn
|
|
7
|
Yang,
C.
|
AAT-5429-2020
|
College of Global Change and Earth System Science, Beijing
Normal University
|
201821490039@mail.bnu.edu.cn
|
|
8
|
Hui,
F. M.
|
AAT-5865-2020
|
School of Geospatial Engineering and Science, Sun Yat-Sen
University
|
huifm@mail.sysu.edu.cn
|
|
9
|
Chen,
Z. Q.
|
0000-0003-0131-3132
(ORCID)
|
School of Geospatial Engineering and Science, Sun Yat-Sen
University
|
chenzq_2019@163.com
|
|
10
|
Li,
X. Q.
|
AAT-5475-2020
|
School of Geospatial Engineering and Science, Sun Yat-Sen
University
|
lixq85@mail.sysu.edu.cn
|
|
11
|
Zhang,
Y. Y.
|
J-5625-2017
|
College of Global Change and Earth System Science, Beijing
Normal University
|
yyzhang@mail.bnu.edu.cn
|
|
12
|
Zhang,
Y.
|
AAT-5442-2020
|
College of Global Change and Earth System Science, Beijing
Normal University
|
-
|
|
13
|
Chen,
X. T.
|
AAT-6570-2020
|
College of Global Change and Earth System Science, Beijing
Normal University
|
-
|
|
14
|
Liu,
A. B.
|
AAT-5467-2020
|
College of Global Change and Earth System Science, Beijing
Normal University
|
-
|
|
15
|
Chen,
Y. T.
|
AAT-5592-2020
|
College of Global Change and Earth System Science, Beijing
Normal University
|
-
|
|
16
|
Guan,
Z. F.
|
AAT-6298-2020
|
College of Global Change and Earth System Science, Beijing
Normal University
|
-
|
|
17
|
Ye,
Y.
|
AAT-6591-2020
|
College of Global Change and Earth System Science, Beijing
Normal University
|
-
|
|
18
|
Shang,
X. Y.
|
AAT-5505-2020
|
College of Global Change and Earth System Science, Beijing
Normal University
|
-
|
|
19
|
Tian,
J. H.
|
AAT-5892-2020
|
College of Global Change and Earth System Science, Beijing
Normal University
|
-
|
|
20
|
Duan,
M. H.
|
AAT-5952-2020
|
College of Global Change and Earth System Science, Beijing
Normal University
|
-
|
|
21
|
Zhang,
Z.Y.
|
AAT-6574-2020
|
College of Global Change and Earth System Science, Beijing
Normal University
|
-
|
3 Methods
A monthly calving
event is defined as an independent calved area in the monthly cycle that is not
spatially adjacent to other calving events that occurred in the same month of
the year. That is, all monthly calving polygons in the same year and month are
required to be spatially non-overlapping and non-adjacent, with each record
representing an independent monthly calving event[2,
13]. In this section, the data and methods used during the development of
this dataset will be introduced.
3.1 Data Sources
Satellite
imagery: Images of the first three days of each month from August 2010 to August
2019 were preferentially selected as the basis for determining the month in
which calving occurred. Satellite imagery coverage is shown in Figure 1.
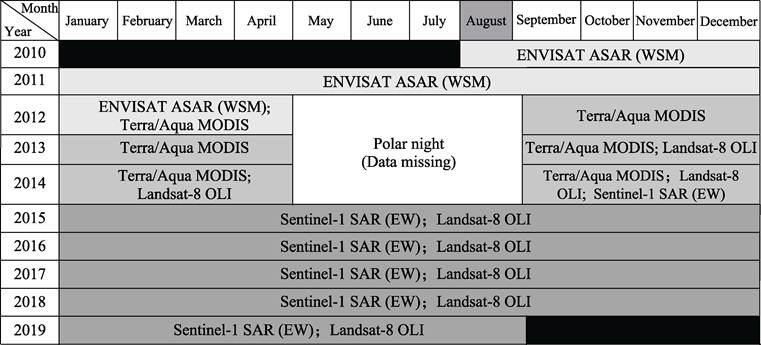
Figure 1 Satellite imagery used in the
development of the ??Monthly iceberg calving dataset of the Antarctica ice
shelves (2010-2019)??
The
ENVISAT satellite was launched by the ESA (European Space Agency). The ASAR
(Advanced Synthetic Aperture Radar) sensor operates in the C-band with a central
frequency of 5.331 GHz, an ASAR WSM imaging width of 400 km, a spatial resolution
of 150 m, and a geospatially encoded pixel pitch of 75 m[14].
The Sentinel-1 satellite was also launched by the ESA. The dual satellite
systems have a revisit period of fewer than 6 days at high latitudes. Both
satellites carry a dual-polarized C-band SAR sensor with a centre frequency of
5.405 GHz. The EW mode is suitable for regions requiring extensive coverage,
such as the polar regions, with an imaging width of 400 km and a spatial
resolution of 40 m[15]. The Terra and Aqua
satellites were launched by NASA and contain 36 channels of MODIS (Moderate
Resolution Imaging Spectroradiometer) sensors with a spectral range of 0.4-14.4 ??m, a revisit
period of 1-2 days, and an imaging width of 2,330 km. The spatial
resolution of moonless products synthesized from Antarctic MODIS (7-2-1 band)
reflectance images is 250 m, based on Antarctic MODIS (7-2-1 band) daily
reflectance image production[16].
The Landsat-8 satellite was also launched by NASA; the revisit period was 16
days. The OLI (Operational Land Imager) sensor has an imaging width of 190 km
and the multispectral band spatial resolution of 30 m[17].
Other
reference data include the annual iceberg calving dataset of the Antarctic ice
shelf (2005-2019)[10].
This dataset records the location and outline of all annual calving events
occurring on the Antarctic ice shelf larger than 1 km2 from August
2005 to August 2019 in shapefile format and provides information on the area,
perimeter, average thickness, mass, recurrence cycle, type of calving, and year
of occurrence in the attribute table. The time resolution of the dataset is
annual.
3.2 Technical Route
The development of the monthly iceberg calving dataset can
be divided into two steps: image preprocessing and iceberg calving monitoring,
as shown in Figure 2. Image pre-processing includes geocoding, geometric
correction, and mosaic production. The pre-processing yields the Antarctic
coastline mosaic at an early date of each month. The iceberg calving monitoring
includes month determination, calved area segmentation, and attribute updating.
For each annual calving event, the images of each month are traversed to
determine the calving condition of each month, and then the annual calving
events are segmented according to the actual month of calving ( Figure 3),
after the vector of the monthly calved area is obtained.
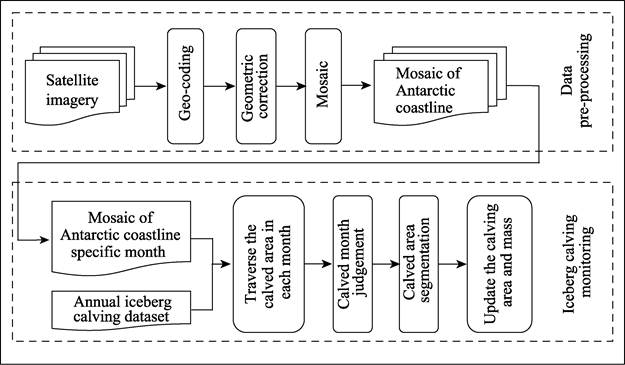
Figure 2 Flow chart of the dataset
development for monitoring monthly iceberg calving events

Figure 3 Schematic of the extraction process
of monthly calving events
4 Data Results and Validation
4.1 Data Products
The
minimum iceberg calving polygon in the monthly iceberg calving dataset is approximately
0.02 km2. The time range is from August 2010 to August 2019, and the
data file is archived in .shp format. The dataset consists of a subset of
Antarctic iceberg calving data for 13 intervals (12 months and one polar night
of 2012-2014) and contains 104 data files, totaling 1,774 data
records. Calving events did not occur in every month of each year. The detailed
information of the subset of the monthly calving dataset in this product and
its specific year of occurrence is described in Table 3. Table 4 shows the
descriptions of the fields in the dataset attribute table.
Table 3 Information on monthly
calving data files of the monthly iceberg calving of the
Antarctic ice shelf
|
No.
|
Filename
|
Description
|
|
1
|
Calving_January
|
Contains calving events in January of each year
from 2011 to 2019
|
|
2
|
Calving_February
|
Contains calving events in February of each year
from 2011 to 2019
|
|
3
|
Calving_March
|
Contains calving events in March of each year from
2011 to 2019
|
|
4
|
Calving_April
|
Contains calving events in April of each year from
2011 to 2013 and 2015 to 2019
|
|
5
|
Calving_May
|
Contains calving events in May of 2011 and each
year from 2015 to 2019
|
|
6
|
Calving_June
|
Contains calving events in June of each year from
2015 to 2019
|
|
7
|
Calving_July
|
Contains calving events in July of each year from
2015 to 2019
|
|
8
|
Calving_August
|
Contains calving events in August of each year
from 2011 to 2012 and 2014 to 2018
|
|
9
|
Calving_September
|
Contains calving events in September of each year
from 2011 to 2018
|
|
10
|
Calving_October
|
Contains calving events in October of each year
from 2011 to 2013 and from 2015 to 2018
|
|
11
|
Calving_November
|
Contains calving events in November of each year
from 2010 to 2018
|
|
12
|
Calving_December
|
Contains calving events in December of each year
from 2010 to 2018
|
|
13
|
Calving_PolarNight
|
Contains calving events during the polar night
(from May to August) in 2011, 2012, and 2013. Due to image quality
limitations, it is not possible to determine the exact month in which the
calving occurred
|
Table 4 Description of the
attribute of the monthly iceberg calving dataset
|
No.
|
Name
|
Unit
|
Description
|
|
1
|
Id
|
‒
|
ID of the calving polygons
|
|
2
|
Year
|
year
|
The year interval in which the calving occurred
(for example, 2015-2016 represents the year it occurred between August 2015 and August
2016)
|
|
3
|
Month
|
month
|
The month in which the calving occurred
|
|
4
|
Year_Mon
|
‒
|
The month and year in which the calving occurred
(the first four digits represent the year, the last two the month)
|
|
5
|
Length
|
km
|
The perimeter of the calved area
|
|
6
|
Area
|
km2
|
The area of the calving event
|
|
7
|
Size
|
‒
|
Calving scale (according to the calved area, 0
stand for tiny-scale calving smaller than 1 km2, 1 for small-scale
calving with an area between 1 and 10 km2, 2 for medium-scale
calving with an area between 10 and 100 km2, 3 for large-scale
calving with an area between 100 and 1,000 km2, 4 for extra-large-scale
calving with an area larger than 1,000 km2)
|
|
8
|
Thickness
|
km
|
The average thickness of the calved area
|
|
9
|
Mass
|
Gt
|
The mass of the calved area
|
|
10
|
Cycle
|
year
|
The calving recurrence interval which comes from
the original annual calving event
|
|
11
|
Type
|
‒
|
The type of calving which comes from the original
annual calving event
|
|
12
|
H_from
|
‒
|
Data source of the thickness
|
4.2 Data Analysis
The frequency of calving of the
Antarctic ice shelf shows a clear seasonal pattern, with calving concentrated
mainly in the austral summer (from December to March) and autumn (from April to
June); calving events in these seasons accounted for 66.9% of the total calving
frequency. The frequency of calving was highest in February, followed by
January and March (26.4%, 22.3%, and 18.2%, respectively), and was the lowest
in July (only 1.7%). The area of calving and the quality of calving also showed
a seasonal distribution, with a monthly increase from December to March, a
decrease in April, a minimum in June, and a small peak in October. An unusual
peak in July was attributed to the extra-large calving of the Larsen C Ice
Shelf, with an area larger than 6,000 km² and a mass of more than 1,100 Gt, in
July 2016.
The frequency, area,
and mass distributions of monthly calving events at different scales weakened
in their seasonal patterns as the scale increased. As shown in Figure 4, the frequency
of small- and medium-sized calving events was highest in February, and the seasonal
trends were similar for the three scales, with the frequency of calving remaining
stable and low between April and October. Similarly, the area and mass of
small- and medium-sized calving events exhibited seasonal characteristics
similar to the frequency distribution. The area and mass of large calving events
were generally high during the austral summer, but high values were also
observed in other months. Extra-large calving events occurred only twice during
the observation period, and their seasonal distribution is not yet known.
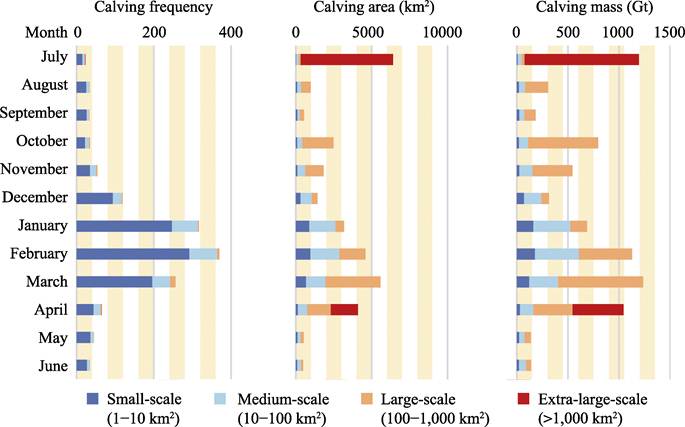
Figure 4 Distribution of the
frequencies, areas, and masses of monthly iceberg calving events at different
scales (2010-2019)
The annual frequencies,
areas, and mass ratios of the small, medium, and large monthly calving events
were relatively stable. As shown in Figure 5, the highest frequency of small
calving events was approximately 60%. The highest percentages of small- and medium-sized
calving events both occurred in January, accounting for 26.8% and 54.3% of the
total area, respectively. The month with the highest percentage of large
calving areas was March, at 64.9%. The distribution and trend of the proportion
of calving mass were similar to that of the calving area.

Figure 5 Ratio distribution
of frequency, area, and mass of monthly iceberg calving at different scales (2010-2019)
The spatial
distribution of the monthly calving of the Antarctic ice shelf from 2010 to
2019 is shown in Figure 6. Small-scale calving events covered the largest area
in January-March when calving events are frequent. In other months,
small- and medium-sized calving events remained most frequent in West
Antarctica, followed by the east of the Amery Ice Shelf in East Antarctica. Few
calving events occurred in the west of the Amery Ice Shelf in East Antarctica.
Large calving events were relatively frequent in West Antarctica during the
observation time interval, with large calving events in February concentrated
in West Antarctica and the Wilkes Land in East Antarctica, but with large
calving events in March scattered across Antarctica. Extra-large calving events
occurred only twice, once in July on the Larsen C Ice Shelf in the Antarctic
Peninsula, and once in April on the Thwaites Ice Shelf in West Antarctica,
respectively.
4.3 Data Validation
The monthly calving area was obtained by splitting the annual calving
area, so the accuracy of the Antarctic ice shelf monthly calving dataset
inherits the extraction accuracy of the annual calving area. The equivalent
perimeter of the calving zone area observation error is 5 m, and the area
observation error is 5 times the calving zone perimeter (m2). The
area of a single monthly calving event is smaller than or equal to its corresponding
annual calving event, so its area observation error is smaller than the area observation
error of the annual calving event; i.e., the annual average calving zone area
observation error is less than 17.1 km².

Figure
6 Cumulative distribution of monthly iceberg calving at
different scales (2010-2019)
5 Discussion and Conclusion
Based on the multisource optical and synthetic aperture
radar (SAR) data covering the Antarctic coastline month by month from 2010 to
2019, we first developed the monthly iceberg calving dataset of the Antarctic
ice shelves (2010-2019) to provide detailed monitoring of the monthly calving
events of the circum-Antarctic ice shelf for nine consecutive years and to
quantitatively assess the seasonal characteristics of the calving of the
Antarctic ice shelf.
Based
on this dataset, we preliminarily analysed the relationship between the monthly
calving of the Antarctic ice shelf and the ice sheet surface melting[18] and
Antarctic sea ice area[19]. The results
show that the frequency of monthly iceberg calving events and the maximum
surface melt area of the ice sheet had similar trends, which were positive but
not significantly correlated. The peak of calving occurred in February, while
the peak of ice-sheet surface melting occurred in January. The frequency of
monthly calving of the Antarctic ice shelf was significantly negatively
correlated with the trend of the Antarctic monthly sea ice area. The most
frequent calving occurred in February when the sea ice area was at its minimum.
Author
Contributions
Cheng, X., Liu, Y., Qi, M. Z., Hui, F. M.,
and Chen, Z. Q. designed the dataset. Qi, M. Z., Feng, Q. Y., Li, X. Q., Zhang,
Y. Y., Zhang, Y., Chen, X. T., Liu, A. B., Chen, Y. T., Guan, Z. F., YE, Y.,
Shang, X. Y., Tian, J. H., Duan, M. H., and Zhang, Z. Y. collected and
pre-processed the remotely sensed data. Qi, M. Z., Feng, Q. Y., Lin, Y. J.,
Wei, Y., and Yang, C. extracted the monthly iceberg calving events. Liu, Y., and
Qi, M. Z. were in charge of the model design and
algorithm. Qi, M. Z. performed data validation. Qi, M. Z. and Liu, Y. wrote the
data paper.
References
[1]
Depoorter,
M. A., Bamber, J. L., Griggs, J. A., et
al. Calving fluxes and basal melt rates of Antarctic ice shelves [J]. Nature, 2013, 502(7469): 89-92.
[2]
Liu, Y.,
Moore, J. C., Cheng, X., et al.
Ocean-driven thinning enhances iceberg calving and retreat of Antarctic ice
shelves [J]. Proceedings of the National
Academy of Sciences of the United States of America, 2015, 112(11): 3263-3268.
[3]
Rignot, E.,
Jacobs, S., Mouginot, J., et al.
Ice-shelf melting around Antarctica [J]. Science,
2013, 341(6143): 266-70.
[4]
Massom, R. A.,
Scambos, T. A., Bennetts, L. G., et al.
Antarctic ice shelf disintegration triggered by sea ice loss and ocean swell
[J]. Nature, 2018, 558(7710): 383-389.
[5]
Pattyn, F.,
Morlighem, M. The uncertain future of the Antarctic Ice Sheet [J]. Science, 2020, 367(6484): 1331-1335.
[6]
Medrzycka,
D., Benn, D., Box, J., et al. Calving
Behavior at Rink Isbræ, West Greenland, from Time-Lapse Photos [J]. Arctic, Antarctic, and Alpine
Research, 2016, 48(2): 263-277.
[7]
Åström, J. A.,
Vallot, D., Schäfer, M., et al.
Termini of calving glaciers as self-organized critical systems [J]. Nature Geoscience, 2014, 7(12): 874-878.
[8]
Wahlin, A. K.,
Steiger, N., Darelius, E., et al. Ice
front blocking of ocean heat transport to an Antarctic ice shelf [J]. Nature, 2020, 578(7796): 568-571.
[9]
Darelius,
E., Fer, I., Nicholls, K. W. Observed vulnerability of Filchner-Ronne Ice Shelf
to wind-driven inflow of warm deep water [J]. Nature Communications, 2016, 7: 12300.
[10]
Qi, M. Z.,
Liu, Y., Cheng, X., et al. Annual
iceberg calving dataset of the Antarctic ice shelves (2005-2019) [J/DB/OL]. Digital Journal of Global Change Data
Repository, 2020. https://doi.org/
10.3974/geodb.2020.04.09.V1.
[11]
Qi, M. Z.,
Liu, Y., Cheng, X., et al. Monthly iceberg
calving dataset of the Antarctic ice shelves (2010-2019) [J/DB/OL]. Digital Journal of Global Change Data Repository, 2020. https://doi.org/ 10.3974/geodb.2020.04.13.V1.
[12]
GCdataPR
Editorial Office. GCdataPR data sharing policy [OL]. https://doi.org/10.3974/dp.policy.2014.05 (Updated 2017).
[13]
Liu Y., Cheng
X., Hui, F. M., et al. Antarctic
iceberg calving monitoring based on EnviSat ASAR images [J]. Journal of Remote Sensing, 2013, 17(3):
479‒494.
[14]
ENVISAT
ASAR WSM [DB/OL]. http://eogrid.esrin.esa.int/browse.
[15]
Sentinel-1 SAR
EW [DB/OL]. https://www.esa.int/ESA.
[16]
Terra Aqua
MODI [DB/OL]. https://worldview.earthdata.nasa.gov/.
[17]
Lanadsat-8 OLI
[DB/OL]. https://www.usgs.gov/.
[18]
Picard, G.,
Fily, M. Surface melting observations in Antarctica by microwave radiometers:
correcting 26- year time series from changes in acquisition hours [J]. Remote Sensing of Environment, 2006,
104(3): 325‒336.
[19]
Stroeve, J.,
Meier, W. N. Sea ice trends and climatologies from SMMR and SSM/I-SSMIS (version
3) [Z]. NASA National Snow and Ice Data Center Distributed Active Archive
Center, 2018.