Dataset Development of Arid Valley
Boundary Displacement and Climate Variability in the Upper Reaches of the Minjiang River
Guo, Y. L.1 Yan, W. P.1,2* Wang, Q.1 Hu, Q.1 Yang, M.1 Zhang, Y.1 Han, Y. W.1
1. School of
Environment and Resource, Southwest University of Science and Technology,
Mianyang 621010, China;
2. Sichuan Academy of Environmental Policy and Planning,
Chengdu 610041, China
Abstract: Arid
valleys are unique geoecological environments within humid environments, and
the displacement of the arid valley boundary is one of the response indicators
of mountain natural ecosystems to climate change. Through visual
interpretation of SPOT images by two individuals, the arid valley boundary in
the upper reaches of the Minjiang River was obtained. The spatial distributions
of climatic factors (annual average temperature, annual precipitation, annual
sunshine duration, annual relative humidity, and annual evaporation) in the
study area were clarified using the radial basis function method. Finally, the
response of arid valley boundary displacement to regional climate change
between 1999 and 2013 was studied. The results were as follows: (1) the climate
in the upper reaches of the Minjiang River exhibited a warm and humid trend
between 1999 and 2013.
(2) The average elevation of the arid valley boundary
decreased by ?C0.76
?? 0.26 m/a. This decrease was significantly associated with the variability of
climate (p = 0.010<0.05), precipitation (p = 0.011<0.05),
and relative humidity (p = 0.020<0.05). Therefore, the downward trend
of the arid valley boundary reflects the improvement in the hydrothermal
balance from 1999?C2013 due to climate variation. The dataset provides
additional information on climate change in the upper reaches of the Minjiang
River. The data accurately reflect the primary displacement trend of the arid
valley boundary within the basin. This study could support further research on
regional responses to global change and guide ecological construction in arid
valley areas. The dataset is archived in .shp, .tif, and .xlsx data formats,
with a data size of 6.34 MB (compressed into one file with a data size of 2.59
MB).
Keywords: arid valley boundary??s displacement;
spatial-temporal distribution; climate variability; Hengduan Mountains
DOI: https://doi.org/10.3974/geodp.2023.03.06
CSTR: https://cstr.escience.org.cn/CSTR:20146.14.2023.03.06
Dataset Availability Statement:
The dataset
supporting this paper was published and is accessible through the Digital Journal of
Global Change Data Repository at: https://doi.org/10.3974/geodb.2023.11.04.V1 or
https://cstr.escience.org.cn/CSTR:20146.11.2023.11.04.V1.
1 Introduction
The
arid valley in the Hengduan Mountains is an unique geoecological phenomenon
encountered in humid and subhumid regions[1, 2]. The complex
topographic and climatic conditions in the region control the formation of arid
river valleys; moreover, localized anthropogenic
disturbances have contributed to arid landscapes with more pronounced
characteristics[3?C5]. The arid valley boundary is
the transition zone between the arid valley scrub landscape and upper montane
forests, whose fluctuations reflect vegetation changes due to the interaction
between natural and anthropogenic factors. The habitats of arid valley boundaries are
highly spatially heterogeneous and dynamic and sensitive to external
environmental changes. Therefore, analyses of arid valley boundaries could
provide an effective way to quickly evaluate the impacts of climate change on
mountainous human-land systems.
The arid
valley in the upper reaches of the Minjiang River is a typical
representation of the dry and warm valleys found in the northern part of the
Hengduan Mountains[6,
7] (Figure 1).
From 1974 to 2000, the arid valley in the
region expanded in size[8], with the highest elevation increasing from 3,128
to 3,181 m at a rate of 2 m/a[9].
Moreover, under the impacts of climate change and human activities, the distribution of desert species such as Convolvulus
tragalanthoides and Nitraria
tangutorum has expanded, and they have become dominant communities in some
areas, further indicating degradation of the ecological environment in these
region[9?C13]. However, there are insufficient
data to support these conclusions. Since 2000, with the implementation of ecological
restoration projects such as returning farmland to forests, the area of the
arid valley in the upper reaches of the Minjiang River has decreased, and the
effect of ecological restoration has been outstanding[14?C16].
However, quantitative studies on arid valley fluctuations and climate change
since 2000 have been limited. In this study, a dataset of the displacement and climate variability of the
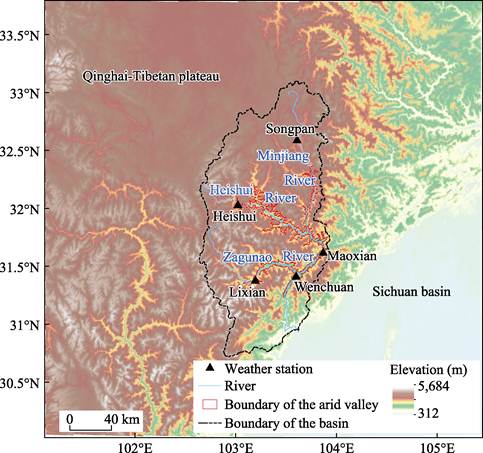
Figure 1 Distribution of the arid valley in the
upper reaches of the Minjiang River
arid valley boundary
in the upper reaches of the Minjiang River was constructed based on SPOT
images, field investigations, and meteorological data. This study aimed to reveal the response
characteristics of the arid valley boundary to regional climate variation from
1999?C2013. Tihs study could enhance the understanding of regional responses
to global changes and provide data support for ecological construction in arid
valleys.
2 Metadata of the Dataset
The
metadata of the Dataset of arid valley boundary displacement and climate
variability in the upper reaches of the Minjiang River (1999-2013)[17] are summarized in Table 1. It includes the dataset??s full name, short name, authors,
year of the dataset, temporal resolution, spatial resolution, data format,
data size, data files, data publisher, and data sharing policy, etc.
Table 1 Metadata summary of the
Dataset of arid valley boundary displacement and climate variability in the
upper reaches of the Minjiang River (1999-2013)
|
Items
|
Description
|
|
Dataset full name
|
Dataset of arid
valley boundary displacement and climate variability in the upper reaches of
the Minjiang River (1999-2013)
|
|
Dataset short
name
|
Boundary_Climate_UpperMinjiang
|
|
Authors
|
Yan, W. P.
L-5250-2016, Sichuan Academy of Environmental Policy and Planning, School of
Environment and Resource, Southwest University of Science and Technology,
wei-po.yan@hotmail.com
Wang, Q.
L-5245-2016, School of Environment and Resource, Southwest University of
Science and Technology, qingw@imde.ac.cn
Guo, Y. L.,
L-5221-2016, School of Environment and Resource, Southwest University of
Science and Technology, guoyalin_linda@163.com Hu, Q., School of Environment
and Resource, Southwest University of Science and Technology,
2635542962@qq.com
Yang, M., School
of Environment and Resource, Southwest University of Science and Technology,
miro-y@swust.edu.cn
Zhang, Y., School
of Environment and Resource, Southwest University of Science and Technology,
1653651783@qq.com
Han, Y. W.,
School of Environment and Resource, Southwest University of Science and Technology,
hanyw1976@163.com
|
|
Geographical
region
|
China
|
|
Year
|
1999, 2013
|
|
Temporal
resolution
|
Year
|
|
Spatial
resolution
|
30 m
|
|
Data format
|
.shp, .tif, .xslx
|
|
|
|
Data size
|
6.34 MB
|
|
|
|
Data files
|
(1) The arid
valley boundary data in 1999 and 2013 (.shp)
(2) The climate
variability data from 1999 to 2013 (.tif)
(3) Statistics of
arid valley boundary displacement and climate variability (. xlsx)
|
|
Foundations
|
Ministry of
Science and Technology of P. R. China (2015BAC05B05-01); National Natural
Science Foundation of China (41601088, 41071115); Natural Science Foundation
of Southwest University of Science and Technology (18zx7117)
|
|
Data publisher
|
Global Change Research Data Publishing & Repository,
http://www.geodoi.ac.cn
|
|
Address
|
No. 11A, Datun
Road, Chaoyang District, Beijing 100101, China
|
|
Data sharing
policy
|
(1) Data are openly available and can be free downloaded via the
Internet; (2) End users are encouraged to use Data subject to
citation; (3) Users, who are by definition also value-added service
providers, are welcome to redistribute Data subject to written permission
from the GCdataPR Editorial Office and the issuance of a Data redistribution
license; and (4) If Data are used to compile new
datasets, the ??ten per cent principal?? should be followed such that Data
records utilized should not surpass 10% of the new dataset contents, while
sources should be clearly noted in suitable places in the new dataset[18]
|
|
Communication and
searchable system
|
DOI,
CSTR, Crossref, DCI, CSCD, CNKI, SciEngine, WDS/ISC, GEOSS
|
3 Methods
3.1 Data Sources
Climatic Data: Climatic data, including the
annual average temperature, annual precipitation, annual sunshine duration,
annual relative humidity, and annual evaporation in the upper reaches of the
Minjiang River, were obtained from the China National
Meteorological Information Centre.
Remote Sensing Data: Due
to the short study time scale, the movement of the arid valley boundary is
likely relatively minor. Therefore, SPOT images were chosen as the base data.
Notably, 1999 imagery was acquired in December 1999 and January 2000 at a
spatial resolution of 10 m, and 2013 imagery was acquired in January 2014 and
February 2014 at a spatial resolution of 1.5 m. Moreover, the concept of the
arid valley is relative, and its definition is not yet uniform[6, 19, 20]. To assess the accuracy of the interpretation of the arid valley
boundary, the arid valley boundary in 1974 was extracted based on Landsat MSS
imagery (with a spatial resolution of 30 m) and compared with existing studies.
3.2 Data Processing
Climatic data processing: The linear tendency estimation method is commonly used to analyze
climatic factor trends[21]. This method
involves fitting a straight line to the data, where the slope of the line
indicates the direction and rate of interannual changes in the climatic
elements. The Mann‒Kendall trend test (M-K test) is a nonparametric statistical
method widely employed to analyze whether there is a sudden change in time
series data[22]. This model was used to
test the significance and reliability of the variability of the climatic
factors in this study. Furthermore, the spatial distribution of climatic factor
variations in the basin was analyzed using the radial basis function method on
the ArcGIS platform[18].
Remote sensing images pre-processing: To ensure the accuracy and reliability of the subsequent data, the
remote sensing data coordinate system was unified as WGS_1984_UTM_Zone_48N,
with its central meridian at 105??E. Then, the remote sensing images were
sequentially preprocessed via geometric correction, orthogonal correction,
image fusion, image mosaicing, image cutting, etc., to ensure an accurate
geometry and facilitate the extraction of precise geographic information at the
subsequent stages[2].
Interpretation of the arid valley boundary: Firstly, representative typical sample areas were selected for
field surveys to obtain information such as latitude, longitude, elevation,
slope, orientation, vegetation types, ground litter, and human activities.
During the field survey, sample points with relatively high coincidence of the
geographic location with Google Earth online images were selected. Eighty-eight
control points and 61 verification points were obtained[23], providing essential references for the subsequent data processing
and geographic information extraction. Secondly, since the SPOT images
contained shaded areas, Landsat images from the same period were referenced to
improve the accuracy and completeness of the data. Combined with the field
survey and unsupervised classification of the remote sensing images, arid
valley boundary interpretation signatures were established based on vegetation
types, image colors, and textural features. Finally, two individuals extracted
the arid valley boundaries through visual interpretation. The consistency of
the extraction results was verified using the maximum likelihood method[24]. When the consistency rate was higher than 90%, the interpretation
results were considered highly reliable, and only inconsistent parts were
revised through consultation. However, when the consistency rate was lower than
90%, the interpretation results were considered less consistent, and
reinterpretation was necessary.
4 Data Results and Validation
4.1 Data Composition
The
dataset of arid valley boundary displacement and climate variability in the
upper reaches of the Minjiang River (1999?C2013) consists of three parts: (1)
the arid valley boundary data in 1999 and 2013; (2) the climate variability
data from 1999 to 2013; and (3) the statistics of arid valley boundary
displacement and climate variability.
4.2 Data Validation
Data validation
focused on verification of the arid valley boundary. On the one hand, the
average elevation of the arid valley boundary in the study increased at a rate
of 1.72 ?? 0.32 m/a between 1974 and 1999. These results are similar to previous
research results based on the highest elevation of the arid valley boundary (2
m/a)[9]. This information serves as a valuable reference for
verifying the accuracy of the displacement of the arid valley boundary. On the
other hand, the research team has studied the ecology and settlement geography
in the upper reaches of the Minjiang River for a long time and has accumulated
valuable information. Additionally, to better understand the regional
ecological characteristics, typical settlements in Li county and Wenchuan
county in the basin were investigated[23], providing basic information for extraction and displacement
analysis of the arid valley boundary. Therefore, this dataset can accurately
reflect the trend in the displacement of the arid valley boundary in the upper
reaches of the Minjiang River.
4.3 Data Products
4.3.1 Climate Variability
From
1999 to 2013, the annual average temperature and precipitation in the upper
reaches of the Minjiang River increased by 0.008 ??/a and 2.25 mm/a, respectively,
with an overall warm-humid climate trend (Table 2). Due to the differences in
climate and regional geographic characteristics, the variations in the climatic
factors exhibited obvious geographical differences. The arid valley center was
drier, and the warm-humid trend was more pronounced. The annual average
temperature and annual precipitation increased the fastest, at rates of
0.018 ??/a and 3.84
mm/a, respectively. In the Heishui River basin, the average elevation was higher,
and the annual average temperature was lower. The warm- humid trend was
relatively weak, with slower increases in the temperature and precipitation
than those in the arid valley center. In the southern part of the upper reaches
of the Minjiang River, the Zagunao River basin exhibited a lower elevation and
a more humid climate. However, the increases in temperature and precipitation
were the slowest, and the warm-humid trend was the weakest. The dataset
provides additional information on climate change in the upper reaches of the
Minjiang River and could provide basic data support for regional environmental
change studies and ecological construction.
4.3.2 Displacement of the Arid Valley Boundary
The displacement of the arid valley boundary
reflects climate change and human activities. The arid valley boundary in the
upper reaches of the Minjiang River was mainly distributed between 1,601 and 3,200
m. The average elevation increased from 2,371 to 2,414 m during the 1974?C1999
period, with a rate of 1.72??0.32 m/a (Figures 2 and 3). This increase rate was
similar to the result based on the highest elevation of the arid valley
boundary (2 m/a)[9],
Table 2 Climate variability in regions
|
Region
|
RT (??/a)
|
RS (h/a)
|
RE (mm/a)
|
RP (mm/a)
|
RH (%/a)
|
|
Arid valley center
|
0.018
|
−5.24
|
−5.40
|
3.84
|
0.08
|
|
Heishui River basin
|
0.006
|
8.17
|
−4.18
|
2.63
|
−0.29*
|
|
Zagunao River basin
|
0.005
|
−25.67*
|
6.92
|
2.12
|
−0.26*
|
|
Whole basin
|
0.008
|
−8.72
|
5.51
|
2.25
|
−0.19*
|
Notes: RT, RS, RE, RP, and RH represent the variation rates
between years of annual average temperature, annual sunshine duration, annual
evaporation, annual precipitation, and annual average relative humidity,
respectively. * means that the variation trend is significant at the significant level (??
= 0.10) based on the M-K Test.
|
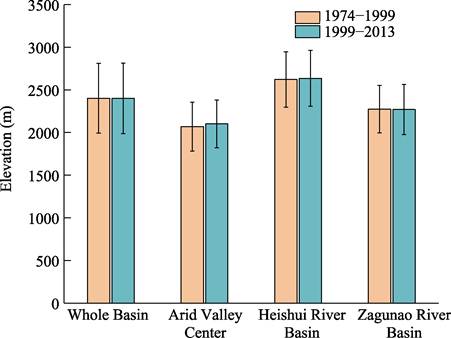
Figure 2 Average elevation of arid valley
boundary in different periods
|
|

Figure 3 Average displacement of arid valley boundary in different periods
|
which
verifies the accuracy of arid valley boundary extraction in this study. From
1999 to 2013, the arid valley boundary moved to lower elevations with an
average rate of ?C0.76??0.26 m/a. Additionally, the movement showed variations in
different regions. The arid valley boundary in the Heishui River basin
exhibited the fastest downward movement (?C0.68 m/a), followed by that in the
Zagunao River basin, at a rate of ?C0.06 m/a. However, the arid valley boundary
at the arid valley center moved upward at a rate of 0.02 m/a. These patterns
were consistent with the precipitation and sunshine duration distributions in the
three regions. Therefore, the displacement of the arid valley boundary
exhibited significant spatial and temporal heterogeneity, closely related to
the climate and changes in climate characteristics during the different periods
and regions, as well as human activities[2]. Between the 1970s and 1990s, the upper reaches of the Minjiang
River experienced continuous increasing trends in the temperature and
precipitation[21]. During the same period,
there was rapid growth in the population, with significant changes in the
livelihoods of residents and socioeconomic development. An increase in human
activities led to more substantial interference with mountain ecosystems,
expansion of arid valleys, and severe degradation in the ecological
environment. Since 1999, the climate in the upper reaches of the Minjiang River
has experienced warming and humidification. Moreover, a series of ecological
projects, such as natural forest protection and return of farmland to forests
and grasslands, have been successively implemented, reducing the disturbance of
arid valley ecosystems by human activities. These projects successfully
inhibited the expansion of arid valleys. Soil erosion in the region has been
effectively controlled, and the habitat of the arid valley has been restored, impeding the rise of the arid valley boundary
to a certain extent. Overall, the fluctuations in the arid valley boundary
resulted from the interactions among multiple factors. This dataset is
important for accurately quantifying the interaction characteristics of factors
and their intrinsic correlation mechanisms. Moreover, the dataset provides
fundamental support for understanding the driving forces of arid valley
boundary fluctuations.
4.3.3 Relationship between the Displacement of the Arid Valley Boundary
and Climate Variability
From
1999 to 2013, the arid valley boundary displacement between 1,601 and 3,000 m
in the upper reaches of the Minjiang River remained relatively stable, with an
average displacement of ‒0.02??0.04 m/a. Principal component analysis and
correlation analysis revealed that the displacement of the arid valley boundary
was significantly negatively correlatedwith regional climate change (i.e., the
first principal component factor) (r=‒0.662, p=0.010<0.05).
Moreover, the arid valley boundary displacement was negatively correlated (p<0.05)
with variations in moisture-related factors (i.e., precipitation, relative
humidity, and evaporation) and positively correlated (r=0.664, p=0.010<0.05)
with variations in heat-related factors (i.e., sunshine duration) (Figure 4).
These findings suggest that as the current trend of climate change intensifies,
the arid valley boundary in the upper reaches of the Minjiang River will
experience slower displacement toward higher elevations but increased
displacement toward lower elevations. Therefore, the displacement of the arid
valley boundary can effectively reflect warm and humid changes in the regional
climate.
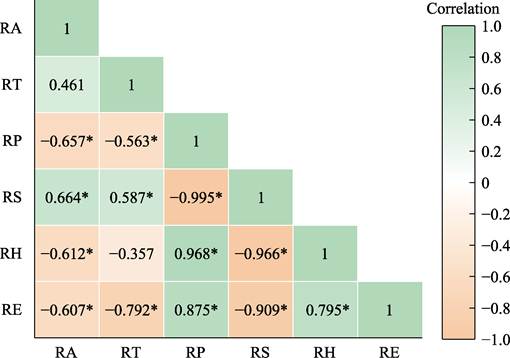
Figure 4 Correlations analysis (*p<0.05.
RT, RS, RE, RP, and RH represent the variation rates between years of annual
average temperature, annual sunshine duration, annual evaporation, annual
precipitation, and annual average relative humidity, respectively)
5 Discussion and Conclusion
The
displacement of arid valley boundaries is a sensitive indicator of mountain
ecosystems responses to climate change[1]. It is
directly affected by habitat characteristics and climate change. Of the arid
valley boundaries in the upper reaches of the Minjiang River, those located
near the upper limit of the settlement niche and woodlands account for only 13%
of the total length. Activities such as grazing and collecting forest products
have been reduced due to the transformation of the livelihoods of ruarl
residents, driven by rapid urbanization and development. Moreover, regional
climatic conditions significantly impact vegetation growth. Therefore, studies
based on arid valley boundary within basins can effectively reveal the
relationship between the displacement of arid valley boundaries and climate change.
From 1999 to 2013, the climate in the upper reaches of the Minjiang River
exhibited a warm-humid trend. The arid valley boundary in the basin moved
downward (0.76??0.26 m/a), and the displacement exhibited a significant negative
correlation with the variability of climate, precipitation, and relative
humidity. Regional climatic variation during this period contributed positively
to improving arid valley habitats[20].
Ecological
construction in the upper reaches of the Minjiang River requires a systematic understanding
of the regional environmental characteristics and reasonable artificial
regulation for effective implementation. The dataset of the displacement of the
arid valley boundary and climate variability in the upper reaches of the
Minjiang River can effectively reveal the spatial differentiation
characteristics and displacement patterns of the arid valley boundary. This
dataset can provide essential data support for studying regional responses to
global climate change and offer scientific guidance for regional ecological
construction. However, due to the lack of a specific definition of arid valley
boundaries, the extraction of arid valley boundaries exhibits certain
inaccuracies. This study provides an essential reference for automatic
extraction of arid valley boundaries based on high-resolution remote sensing
images. Furthermore, the arid valley in the upper reaches of the Minjiang River
is an important ethnic corridor in Southwest China, and differences in the
livelihood strategies of mountain residents exert different impacts on the
natural environment[25?C27]. The dataset can also provide helpful methods for exploring the
effects of the livelihood choices of residents on changes in arid valley
boundaries on long time scales.
Author Contributions
Wang, Q. and Guo, Y. L. designed the
algorithms of the dataset. Yan, W. P., Guo, Y. L., and Yang, M. contributed to
the data processing and analysis. Hu, Q., Han, Y.W. and Zhang, Y. contributed
to the data validation. Yan, W. P. wrote the data paper.
Conflicts of Interest
The authors
declare no conflicts of interest.
References
[1] Zhen, D. Qinghai‒Xizang Plateau and its effects on regional
differentiation of physical environments in West China [J]. Quaternary Sciences, 2001, (6): 484‒489.
[2] Guo, Y. L. Relationships between the Tibetan and Qiang settlements??
habitat differentiation and climate change in the Upper Reaches of the Min
River, China [D]. Mianyang: Southwest University of Science and Technology,
2018.
[3] Bao, W. K., Wang, C. M. Degradation mechanism of mountain ecosystem
at the dry valley in the upper reaches of the Minjiang River [J]. Mountain
Research, 2000, 18(1): 57‒62.
[4] Chen, G. J., Tu, J. J., Fan, H., et
al. The theory and practice of ecological construction in the upper reaches
of Minjiang River [M]. Chongqing: Southwest China Normal University Press,
2006.
[5] Dong, Y. F., Xiong, D. H., Su, Z. A., et al. The distribution of and factors influencing the vegetation
in a gully in the Dry-hot Valley of southwest China [J]. Catena, 2014,
116: 60‒67.
[6] Zhang, R. Z. The dry valleys of the Hengduan Mountains region [M].
Beijing: Science Press, 1992: 20‒25.
[7] Fan, J. R., Yang, C., Bao, W. K., et al. Distribution scope and district statistical analysis of Dry
Valleys in Southwest China [J]. Mountain Research, 2020, 38(2): 303‒313.
[8] Ding, M. T., Zhou P., Zhang, Y. W., et al. Quantitative determination of boundary fluctuation in arid
valley of the Upper Min River and its evolution feature [J]. Mountain
Research, 2017, 35(2): 170‒178.
[9] Yang, Z. P., Chang, Y., Bu, R. C., et al. Long?Cterm dynamics of dry valleys in the upper reaches of
Mingjiang River, China [J]. Acta Ecologica Sinica, 2007, 27(8): 3250‒3256.
[10] Liu, W. B. Flora of semi?Carid valley shrubs at the upper reaches of
Minjiang River [J]. Mountain Research, 1992, 10(2): 83‒88.
[11] Fang, S., Zhao, Y. H., Han, L., et
al. Boundaries and characteristics of arid regions in mountain valleys in
Southwestern China [J]. Mountain Research
and Development, 2018, 38(1): 73‒84.
[12] Nan, X., Yan, D., Li, A. N., et
al. Mountain hazards risk zoning in the upper reaches of Minjiang River
[J]. Journal of Catastrophology, 2015, 30: 113‒120.
[13] Sun, L., Cai, Y., Yang, W., et
al. Climatic variations within the dry valleys in southwestern China and
the influences of artificial reservoirs [J]. Climatic Change, 2019, 155: 111‒125.
[14] Wang, H. J., Guo, Y. L., Wang, Q. Boundary displacement
characteristics of the dry valley in the upper reaches of the Minjiang River
during the period from 1999 to 2009 [J]. Journal
of Lanzhou University: Natural
Sciences, 2017, 53 (3): 316‒321.
[15] Zhou, Y. Z., Wei, J. L., Shao, H. Y. Monitoring the scope changes of
dry valleys in Maoxian area based on RS and GIS [J]. Geomatics & Spatial
Information Technology, 2016, 39 (1): 38‒40.
[16] Fan, M., Li, F. C., Guo, Y. L., et
al. Effects of Grain for Green Project on changes in ecosystems service
values of alpine settlement area in the upper reaches of the Minjiang River
[J]. Mountain Research, 2016, 34: 356‒365.
[17] Yan, W. P., Wang, Q., Guo, Y. L., et al. Dataset of arid valley boundary??s displacement and climate
variability in the upper reaches of Minjiang River (1999?C2013) [J/DB/OL]. Digital Journal of Global Change Data
Repository, 2023. https://doi.org/10.3974/geodb.2023.11.04.V1.
[18] GCdataPR Editorial Office. GCdataPR data sharing policy [OL].
https://doi.org/10.3974/dp.policy. 2014.05 (Updated 2017).
[19]
Gao, Y. Y., Liu, Q., Wang, H.
R., et al. Definition dry valleys
scope by RS and GIS [J]. Journal of
Beijing Normal University (Natural Science), 2012, 48(1): 92‒96.
[20]
Yuan, H., Li, X. W., Lin, Y.
Arid river valley division research in Sichuan Province based on remote sensing
[J]. Journal of Sichuan Agriculture University, 2013, 31(2): 182‒187.
[21]
Li, Z. X., He, Y. Q., Xin, H.
J., et al. Spatio?Ctemporal variations
of temperature and precipitation in Mts. Hengduan Region during 1960?C2008 [J]. Acta
Geographica Sinica, 2010, 65(5): 563‒579.
[22]
Gocić, M., Trajković, S.
Analysis of changes in meteorological variables using Mann-Kendall and Sen??s
slope estimator statistical tests in Serbia [J]. Global and Planetary Change, 2013, 100: 172‒182.
[23] Wang, Q., Zhai, Z. The Lower Timberline Dataset in the Upper Reaches
of Minjiang River, China (1999-2009)
[J/DB/OL]. Digital Journal of Global Change Data Repository, 2016.
https://doi.org/10.3974/ geodb.2016.04.18.V1.
[24] Guo, Y. L., Wang, Q., Fan, M. Exploring the relationship between the
arid valley boundary??s displacement and climate change during 1999-2013 in the upper reaches of the Min River, China [J]. ISPRS International Journal of Geo-Information,
2017, 6(5): 146.
[25] Yang, J., Dai, J. H, Yao, H. R., et
al. Vegetation distribution and vegetation activity changes in the Hengduan
Mountains from 1992 to 2020 [J]. Acta Geographica Sinica, 2022, 77(11):
2787‒2802.
[26]
Zhou, W., Guo, S., Deng, X., et al. Livelihood resilience and
strategies of rural residents of earthquake- threatened areas in Sichuan
Province, China [J]. Nature Hazards,
2021, 106: 255‒275.
[27] Fang, Y. P., Fan, J., Shen, M. Y., et al. Sensitivity of livelihood strategy to livelihood capital in
mountain areas: Empirical analysis based on different settlements in the upper
reaches of the Minjiang River, China [J]. Ecological
Indicators, 2014, 38: 225‒235.