Hydrologic CTD Dataset Obtained through Chinese Arctic Expeditions
Liu, N.1 Wang, Y. J.1 Zhang, J.2 Lin, L. N.1* Chen, H. X.1 Kong, B.1,3 He, Y.1
1. The First Institute of Oceanography, State Oceanic Administration, Qingdao 266061, China;
2. Polar Research Institute of China, Shanghai 200136, China;
3. School of Ocean and Earth Science, Tongji University, Shanghai 200092, China
Abstract: As an important part of the global climatic system, the Arctic is a key cold source that drives global climatic change. In recent years, with the mounting impact of the arctic climatic changes, such issues as polar environmental change, polar resource exploration and polar environmental protection have been hotspots of polar research. In-depth polar research may be conducted on the basis of high-quality field survey data. Until 2014, China has completed six scientific expeditions to the Arctic seas including the Bering Sea, Chukchi Sea, Canada Basin, Nordic Sea and high-latitude Arctic seas. Based on the CTD data collected in the process of the expeditions, in combination with the field records on voyage, data processing software, the paper normalizes the data from different collecting equipments and methodologies. Finally, we develop a dataset with vertical resolution and consist of pressure, depth, temperature, salinity, density, sound velocity and potential temperature. This is one of the outcomes from China’s scientific expedition to the Arctic and facilitates the related polar studies.
Keywords: Arctic; hydrologic; CTD; Chinese Arctic expedition
1 Introduction
Since China launched the first scientific expedition to the arctic in 1999, research on arctic region has been focusing on physical oceanography. The highly accurate, stable and reliable CTD (temperature, salinity and depth) survey is considered basic and most important to understand the hydrological environment of polar seas. Having completed six scientific expeditions to the Arctic until 2014, China has obtained a wealth of historical CTD survey data and gained rich experience in Arctic hydrologic survey. As the primary basis of researching the physical ocean environment of the Arctic, the hydrologic CTD data of the Arctic seas is considered important and basic to understand the hydrologic properties and circulation feature of the seas and developed on the basis of those collected in the process of each expedition to the Arctic, including the pressure, depth, temperature, salinity, density, sound velocity and potential temperature.
2 Metadata of Dataset
The descriptions of the “CTD dataset from China Arctic explorations (1999-2014)” dataset [1] are recorded. These information include the dataset full name, dataset short name, corresponding author, authors, geographical regions of the dataset content, year of the dataset, spatial and temporal resolution, data publisher and data sharing policy (Table 1).
Table 1 Summary of the CTD_data_Arctic_China_1999-2014 metadata
|
Items
|
Descriptions
|
|
Dataset full name
|
CTD dataset from China Arctic explorations (1999-2014)
|
|
Dataset short name
|
CTD_data_Arctic_China_1999-2014
|
|
Corresponding author
|
Lin, L. N. L-6637-2016; linln@fio.org.cn
|
|
Authors
|
Liu, N. L-6646-2016, The First Institute of Oceanography (SOA), liun@fio.org.cn
Wang, Y. J. A-3180-2017, The First Institute of Oceanography (SOA), wangyj@fio.org.cn
Lin, L. N. L-6637-2016, The First Institute of Oceanography (SOA), linln@fio.org.cn
Zhang, J. L-4784-2016, Polar Research Institute of China, zhangjie@pric.org.cn
Chen, H. X. A-4871-2017, The First Institute of Oceanography (SOA), chenhx@fio.org.cn
Kong, B. A-3202-2017, Tongji University, kongbin@fio.org.cn
He, Y. A-3216-2017, The First Institute of Oceanography (SOA), heyan@fio.org.cn
|
|
Geographical region
|
The geographical region covers 52°42′-88°24′N and 19°17′ -143°30'W, mainly include the Bering Sea, the Chukchi sea, the Canada Basin, the Nordic Sea and the high-latitude Arctic seas
|
|
Time
|
1999, 2003, 2008, 2010, 2012 and 2014
|
|
Spatial resolution
|
1 m in vertical
|
|
Data format
|
.dat
|
|
Data Size
|
57 MB
|
|
Foundation(s)
|
Ministry of Science and Technology of P. R. China (2014T02, 2014G02); State Oceanic Administration of P. R. China (CHINARE2016-03-01, CHINARE2016-04-03, 201205007)
|
|
Data publisher
|
Global Change Research Data Publishing & Repository, http://www.geodoi.ac.cn
|
|
Address
|
No. 11A, Datun Road, Chaoyang District, Beijing 100101, China
|
|
Data sharing policy
|
Data from the Global Change Research Data Publishing & Repository includes metadata, datasets (data products), and publications (in this case, in the Journal of Global Change Data & Discovery). Data sharing policy includes: (1) Data are openly available and can be free downloaded via the Internet; (2) End users are encouraged to use Data subject to citation; (3) Users, who are by definition also value-added service providers, are welcome to redistribute Data subject to written permission from the GCdataPR Editorial Office and the issuance of a Data redistribution license; and (4) If Data are used to compile new datasets, the ‘ten per cent principal’ should be followed such that Data records utilized should not surpass 10% of the new dataset contents, while sources should be clearly noted in suitable places in the new dataset[2]
|
3 Coverage and Components of the Dataset
3.1 Arctic Geographical Range Covered
The hydrologic CTD dataset of the Arctic expeditions is associated with the areas of 52°42′N-88°24′N and 19°17′W-143°30′W shown in Figure 1, which mainly include the Bering Sea, the Chukchi sea, the Canada Basin, the Nordic Sea and the high-latitude Arctic seas. To facilitate data development and downloading, the hydrologic features of each station are included in a data file.
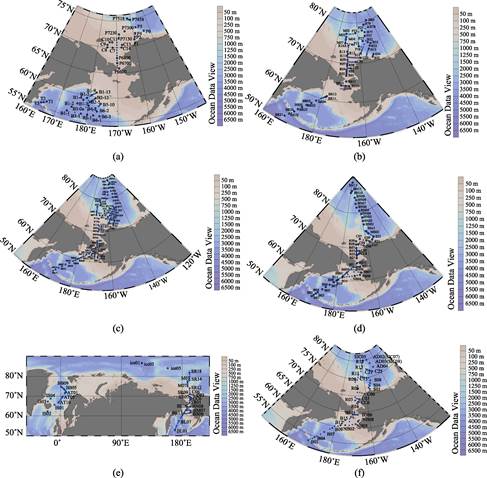
Figure 1 CTD stations of Chinese first to sixth Arctic scientific expeditions
3.2 Components
The hydrologic CTD dataset of the Arctic expeditions consists of 640 data files (.dat), each of which covers pressure (db), depth (m), temperature (°C), salinity (psu), density (kg/m3), sound velocity (m/s) and potential temperature (°C). Each dataset is named after the measurement station name. For example, B1-1.dat covers the hydrologic CTD data of B1-1 station.
Table 2 CTD data statistics of Chinese Arctic expeditions (1999, 2003, 2008, 2010, 2012, 2014)
|
Cruise No.
|
No. of data files
|
Main geographical region
|
CTD type
|
Remarks
|
|
1
|
86
|
the Bering Sea, the Chukchi sea
|
MRK3/FSI
|
1 m interval
|
|
2
|
115
|
the Bering Sea, the Chukchi sea, the Canada Basin
|
MRK3/SBE25
|
1 m interval
|
|
3
|
120
|
the Bering Sea, the Chukchi sea, the Canada Basin and the high-latitude Arctic seas
|
SBE911
|
1 m interval
|
|
4
|
130
|
the Bering Sea, the Chukchi sea, the Canada Basin and the high-latitude Arctic seas
|
SBE911
|
1 m interval
|
|
5
|
99
|
the Bering Sea, the Chukchi sea, the Nordic Sea and the high-latitude Arctic seas
|
SBE911
|
1 m interval
|
|
6
|
90
|
the Bering Sea, the Chukchi sea, the Canada Basin and the high-latitude Arctic seas
|
SBE911
|
1 m interval
|
4 Methods
The quality of CTD data mainly depends on the methods of data collecting and processing[3]. In the course of making on-site and comparative measurement on original data, related technicians must strictly observe the survey specification and instrument operation procedure to ensure the properties of the water mass of the measured areas are reflected as accurate as possible; data is processed through technical calibration and processing of original data for the purpose of improving the accuracy and quality and even providing efficient and concise information for further research and application[4].
4.1 Data Collection
Current polar CTD surveys are mainly made with the SBE 911 unit from Sea-Bird Electronics Inc. and the data obtained through the surveys are processed with the SBE data processing software provided by the instrument producer. It is important to ensure the accuracy of data since any minor change in the oceanographic parameters like temperature and salinity might lead to a large change in the water mass property for sensitive polar seas.
CTD operation mainly involves indoor and outdoor operations, of which the indoor operation is to control the process and the outdoor operation is to lift and lower underwater units. The two should act in a closely coordinated manner. Internationally, a standard method is prepared in terms of access to CTD data, with the specific observation steps and requirements indicated as follows:
a. Record the related information in the format indicated in Table D.8 of the Hydrological Specification during the observation. Input the date of observation, file name, station position (longitude and latitude) and other related parameters into a computer;
b. Before lowering, check the fastness and reliability of mechanical connection and the water tightness of underwater units and water samplers. Lower the instrument after adjustment to the normal operation condition;
c. Lower underwater units under the sea level to submerge the sensor for 3-5 min. For real-time display CTD, record the depth when the probe surfaces (or pressure) before observation; for self-contained CTD, confirm whether at least 3 groups of data have been recorded at the sea level according to the sample interval before observation;
d. Determine the speed of lowering probe based on the depth of water and the model of the instrument used, which should be around 1.0 m/s generally. Allow a faster lowering speed (≤1.5 m/s) under the thermocline in deep-sea seasons. Lower the instrument at a constant speed in the process of observation. If the ship shakes acutely, properly increase the lowering speed to avoid frequent change in depth (or pressure) in the process of data observation. The probe is likely to be spontaneously heated (especially temperature) if it is lowered at a very low speed, making the immersion speed become negative; if at a very high speed approximate to the ultimate speed, the cables and wire ropes will knot when the ship shakes, thus imposing an adverse impact on the instrument;
e. To ensure the quality of the data measured, regard the data obtained in the process of lowering the instrument as the formal value measured and the data obtained in the process of lifting the instrument as the reference value for water temperature data processing for the reason that the value measured is associated with the seawater of original temperature, salinity and depth as the sensor, located at the bottom of the probe, is at the water layer where the original structure is unbroken and will not be affected by the vortex at the probe tail;
f. Immediately read or check the records upon acquisition. In case any missing data, abnormal data, discontinuous or indistinct recording curve is found, promptly make additional measurement. If any temperature data measured is incorrect, check the temperature measurement system of the probe to find out the reason and remove faults.
To meet the requirement of the marine subjects including marine chemistry and marine organism for water sampling, CTD profile observation is generally made at each ocean station. Given certain conditions, ship-based CTD profile observation is also made at the time of observation at the ice station. Due to the different on-site operation conditions, requirements and water depth, CTD profile records are not kept on the whole. In general, water samplers are used in the process of CTD profile observation to sample water in the course of lifting the instrument. To avoid any disturbance generated in the process of sampling water, due to the late response in the course of lifting pressure sensor, original records kept in the process of lowering are used to process data as necessary. In consideration of the overall deviation, incomplete or incorrect original data records arising out of instruments or the lack of complete records on each level, original records are reflected as complete and authentic as possible. In fact, the reports on the expeditions to the Arctic since the second expedition has provided a certain limitations to ensure the quality of on-site data[5].
4.2 Data Processing
With the increase in the duration of observation, or under the effect of surrounding observation environment, the data measured like temperature, conductivity, pressure and dissolved oxygen will change to a certain extent, thus directly affecting the reliability of the data measured. Unless quality control measures are taken, no high-quality data will be obtained regardless of the quality and measurement accuracy of the CTD used[6]. In addition to proper operation of CTD, processing original data is also required. In general, keep one data every meter upon submission of original data by assuming the depth is 0 m, 1 m and 2 m when the mean is within the range of 0-0.5 m, 0.5-1.5 m and 1.5-2.5 m respectively, and so on. SBE data processing software could be used to process the original CTD data obtained based on the following steps:
a. Sea save: Access to original data;
b. Data Conversion: Convert the data of original binary or hexadecimal data files to turn them into project files (.cnv) available for further processing. Choose the data control parameters, format of output files, scope of data conversion, type of output files, parameter of water sampling files and data output parameter to process. In the process of selecting data scope, the sample data obtained during lowering should be preferred and those obtained during lifting should be used for reference for the SBE CTD lowered forward[7]. Other than the data calculated based on pressure, temperature (ITS-90) and conductivity (s/m), such as salinity and density, the parameters including pressure, digiquartz, temperature and conductivity are allowed to be converted. In the process of each processing, alteration must be made to the depth measured among the output depth; in addition, as the water sampling pump could only start operation under a certain pressure reached in the process of lowering CTD, the data collected previously is inaccurate and required to be filtered with the MATLAB software;
c. Filter: A filter is designed to match the time constant of temperature and salinity, and smooth pressure signals for deleting knotted data resulting from the shaking ship. As indicated in the CTD file, conductivity = 0.03 s, pressure = 0.15 s;
d. Align CTD: Due to the assembly design of the instrument, incline in the process of lowering CTD, inter wave and the change in the temperature-salinity structure in the process of mixture, the data obtained through the CTD temperature and salinity sensors fails to truly reflect the property of the water mass of the depth to which the pressure sensor corresponds. Therefore, it is necessary to adjust the difference between the temperature and salinity sensors and the pressure sensor in time to obtain accurate data;
e. Cell Thermal Mass: As a conductive cell is made of plastics and glasses which may store energy, the water flowing through the conductive cell will be heated when the hot water in an electrode cell become cold; otherwise, the water flowing through will be cooled. Therefore, the conductivity is required to be amended since the measured and calculated value will be affected in the process of heat conduction between the conductive unit and the surroundings. Accordingly, primary and secondary all with alpha = 0.03, 1/beta = 7.0;
f. Loop Edit: In the event of up-and-down motion of the ship, the speed of lowering the instrument will change. In particular, to a fierce extent, data will knot, thus resulting in incorrect sampling results. Each reduction in the lowering speed will make the sensor repeatedly sample water at the same layer and thus result in inaccurate data. However, such error in original data essentially results from the effect of the instrument on the layer of water sampled, making it impossible to amend incorrect data which may only be removed by the Loop Edit module. According to the parameters indicated in the header of input files and user setting parameters, the samples in the input files, of which the pressure changes slowly and which are upside-down, are marked with the character “Error” to prevent the related data being deleted in the process of future data processing. To mark incorrect data, it is suggested to set a minimum speed standard or set an average speed of lowering within a period;
g. Bin Average: As required for scientific research, original data is averaged in terms of time or depth. This module provides six methods of averaging data including those from the perspective of pressure (interpolation is allowed), pressure (interpolation is not allowed), depth (interpolation is allowed), sample No., duration of sampling (second), duration of sampling (hour). Following parameters should be provided: range of average, range of input data, whether or not to average data for the surface layer, average value and location of surface. In such case, pressure = 1;
h. Derive: Calculate the salinity, density, potential temperature and density based on the measured P, T and C. Allow the interchange between Derive and Bin Average as the final result obtained will not be affected;
i. ASCII Out: Remove unnecessary header information from the files.
High-quality and highly accurate oceanographic survey data not only provides a basis for describing and analyzing the basic properties of seawater like the distribution and change of temperature, salinity and density, but also plays a significant role in the studies of such subjects as physical oceanography, marine geology, chemistry and biology[8].
5 Data Evaluation
Exampled by the Chinese fifth Arctic scientific expedition, a comparison is made between the temperature-salinity probe data of the southernmost station BL12 (observation depth of 201 m) and that of the northernmost station R05 (observation depth of 40 m) as shown in Figure 2. The red, blue and black full line stands for the difference in temperature, conductivity and salinity respectively. Through calculation, the conductivity is accurate to the value between 0.005 and 0.008. In the same manner, the accuracy of the data of other voyages is initially evaluated. Such parameters as density, potential temperature and density are calculated based on the measured parameters. From a whole point of view, such data is highly reliable and typical.
6 Conclusion
|
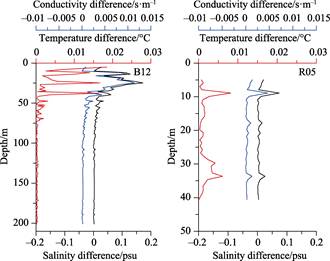
Figure 2 Data differences between double probes of B12(left) and R05 (right) stations in the Chinese fifth Arctic scientific expedition
|
The hydrologic CTD dataset of the Arctic seas is based on the CTD survey data obtained in the process of the Chinese sixth Arctic scientific expedition with the vertical resolution of 1 m. As the basis of polar physical oceanography research, it not only plays an important role in contributing to the research of polar marine geology, biology and chemistry, but also becomes essential to truly reflect the polar ocean environment.
Author Contributions
Liu, N. designed the study. Lin, L.N., Wang, Y.J., and Zhang, J. wrote the paper. Chen, H.X., Kong, B., and He, Y. contributed to the data processing and analysis.
References
[1] Liu, N., Wang, Y, J., Zhang J., et al. CTD dataset from China Arctic explorations (1999-2014) [DB/OL]. Global Change Research Data Publishing & Repository, 2016. DOI: 10.3974/geodb.2016.01.14.V1.
[2] GCdataPR Editorial Office. GCdataPR Data Sharing Policy [OL]. DOI: 10.3974/dp.policy.2014.05 (Updated 2017).
[3] Fang, X. H. Quality Control for CTD Data [M]. Qingdao: China Ocean University Press, 1992.
[4] Lin, J. G., Wu, Z. D., Chen, J. Data processing of SBE 19 CTD [J]. Hydrographic Surveying and Charting, 2001, (1): 52-54.
[5] Chen, H. X., Liu, N., Zhang J., et al. China Polar Scientific Expedition Hydrological Data Atlas Introduction [M]. Beijing: Ocean Press, 2014.
[6] Xu, J. P., Su, J. L. Simple analysis of the qualitative control for CTD data [J]. Acta Oceanologica Sinica, 1999, 21(1): 126-132.
[7] Chen, M., Li, Z. Q., Yuan, Y. M., et al. Analysis of processing of CTD data of seabird series [J]. Hydrographic Surveying and Charting, 2004, 24(6): 62-64.
[8] Kuang, X. D., Guo, X. S., Fan, H. T. Pre-processing and standardization discussion of CTD data [J]. Ocean Technology, 2009, 28(2): 33-36.