1-km Grid NPP Dataset Covering Ecological Barrier
Zone of China (2000–2015)
Wang, X. F.1,2*
Wang, Y.1 Yin, L.
C.3,4
1. The College of Land Engineering, Chang??an
University, Xi??an 710054, China;
2. The Key Laboratory of Shaanxi Land
Consolidation Project, Chang??an University, Xi??an 710054, China;
3. Key Laboratory of Land Surface Pattern and
Simulation, Institute of Geographic Sciences and Natural Resources Research,
Chinese Academy of Sciences, Beijing 100101, China;
4. University of Chinese Academy of Sciences, Beijing 100101, China
Abstract: As the basis of ecosystem material and energy cycle, Net Primary
Productivity (NPP) can reflect the carbon sequestration capacity of vegetation
at regional and global scales, which is an important indicator to evaluate the
quality of terrestrial ecosystem. Aiming at the production of NPP, based on the
principle of light energy utilization rate model and coupled with remote
sensing, meteorology, vegetation and soil type data, we conducted a modeling
study on the ecosystem productivity of the national barrier zone. In the
calculation of parameters, the photosyntheticallyactive radiation (APAR) was
calculated from the data of MOD13A2 NDVI, vegetation map of China, total solar radiation, temperature and precipitation. Compared
with other studies and models, the regional evapotranspiration model was used
to simulate water stress, in which complex soil parameters are avoided and the
operability of the model is enhanced. Taking APAR and actual light energy
utilization rate (??) as input variables of parameterized model-CASA model, the
estimation of the national ecological barrier zone 1-km resolution Net Primary
Productivity dataset from 2000 to 2015 was realized. Compared with MOD17A3 NPP
data of 2000, 2005, 2010 and 2015, the two data have good consistency. The dataset
is archived in .tif format (unit: gC·m–2), and the projection
coordinate system is WGS_1984_Albers. The spatial resolution is 1-km, and the
total size of compressed dataset is 53.8 MB.
Keywords: national ecological barrier zone; Net Primary Productivity; light
energy utilization rate; CASA model; geographical research
Dataset Available Statement:
The dataset supporting this paper was published
at: Wang, X. F., Wang, Y., Yin, L. C. 1-km
NPP product in national barrier zone of China (2000-2015) [J/DB/OL]. Digital Journal of Global Change Data Repository,
2020. DOI: 10.3974/geodb.2020.03.10.V1.
1 Introduction
Net Primary Productivity (NPP) refers to the total
amount of organic matter produced by green plants in unit time and area in
terrestrial ecosystem[1], that
is, the difference between carbon absorbed by photosynthesis and carbon
released by respiration[2]. It is the result of mutual adaptation of
plant biological characteristics and external environment, and is the material
and energy basis for the survival of heterotrophic organisms. As the core
parameter of terrestrial ecosystem carbon cycle[3],
NPP can not only represent the assimilation effect of the
ecosystem on carbon[4], but also is an important index to evaluate
the stability of ecological structure and function[5]. NPP is also the main factor to determine the carbon source/sink
and regulate the ecological process[6].
Therefore, scholars attach great importance to the study of NPP, and global
change and terrestrial ecosystem (GCTE) has identified NPP as one
of the core contents of the research[7].
??Two Barriers and
Three Belts?? ecological barrier zone is an important part of
the national ecological security strategic pattern. In response to the ??two
barriers and three belts?? national ecological security barrier framework
proposed by the government in the national major function oriented zoning, Fu et al.[8] described the scope of the national barrier zone on the
basis of ensuring the integrity of the county and carried out a comprehensive
assessment of ecosystem services from 2000 to 2010. The main purpose of this
dataset is to construct NPP time series products of national barrier zone, to
carry out research on trade-offs and synergies of ecosystem services, and to
ensure the well-being of mankind.
The national ecological barrier zone 1-km resolution Net Primary Productivity
dataset (2000–2015) is an important output of ecosystem service science. It is
also a vital digital resource for monitoring and evaluating NPP evolution of
ecological environment and sustainable development of ecosystem. In this study,
we introduced the detailed information of the data, the basic principles of the
algorithm, and verified the accuracy of the data.
2 Metadata of the Dataset
The
metadata of the dataset[9] are summarized in Table 1. It includes the dataset full name, short name,
authors, year of the dataset, temporal resolution, spatial resolution, data
format, data size, data files, data publisher, and data sharing policy, etc.
3 Methods
The production of national ecological barrier zone 1-km resolution Net
Primary Productivity dataset (2000–2015) is based on a 16 day composite product
of MOD13A2 1-km vegetation index[11], China surface climate data daily dataset (V3.0)[12], etc. Based on the CASA model, the quantitative
output of NPP was obtained.
3.1 Study Area
The national
barrier zone (22??45¢N-53??34¢N, 82??50¢E-134??22¢E)
includes the ecological barrier of the Qinghai Tibet Plateau, the northeastern
forest zone, the northern sand belt, Sichuan Yunnan-Loess Plateau ecological
barrier and the southern hill and mountain belt[13].
The total area of the barrier zone is 3,114,874.36 km2, accounting
for about 1/3 of the total land area of China. It includes 18 provinces and 482
counties. The precipitation decreases from southeast to northwest, and the
annual average temperature is -6 - 23 ??C. The ecosystem types of the
study area are diverse and the natural environment is complex[13-15].
3.2 CASA Model
The Carnegie Ames-Stanford Approach (CASA)[16] model based on the principle of
light energy utilization was used to quantify the annual NPP in the national
ecological barrier zone.
Table 1 Metadata summary of the dataset
|
Items
|
Description
|
|
Dataset
full name
|
1-km
NPP product in national barrier zone of China (2000-2015)
|
|
Dataset
short name
|
NBZ_NPP_1km_2000-2015
|
|
Authors
|
Wang,
X. F. AAS-5271-2020, The College of Land Engineering; the Key Laboratory of
Shaanxi Land Consolidation Project, Chang??an University, wangxf@chd.edu.cn
Wang,
Y. AAS-5036-2020, The College of Land Engineering, Chang??an University, wangyichangan134@163.com
Yin,
L. C. AAS-4914-2020, Key Laboratory of Land Surface Pattern and Simulation,
Institute of Geographic Sciences and Natural Resources Research, Chinese
Academy of Sciences; University of Chinese Academy of
Sciences,yinlichang3064@163.com
|
|
Geographical
region
|
The
provinces include Heilongjiang, Jilin, Qinghai, Gansu, Sichuan, Xinjiang,
Inner Mongolia, Hebei, Liaoning, Tibet, Ningxia, Yunnan, Guangxi, Guangdong,
Guizhou, Hunan, Jiangxi and Shanxi
The
northern sand belt (36??45¢N-45??06¢N, 75??50¢E-124??18¢E)
The
ecological barrier of the Qinghai Tibet Plateau (29??40¢N-38??10¢N, 82??50¢E-105??5¢E)
Sichuan
Yunnan-Loess Plateau ecological barrier (24??10¢N-38??50¢N, 99??05¢E-114??25¢E)
The
southern hill and mountain belt (22??45¢N-27??10¢N, 103??10¢E-119??15¢E)
The
northeastern forest zone (40??52¢N-53??34¢N, 118??48¢E-134??22¢E)
|
|
Year
|
2000-2015 Temporal
resolution 1 year
|
|
Spatial
resolution
|
1 km Data
format .tif
|
|
Data
size
|
53.8 MB
(After compression) Projection
coordinate system WGS_1984_Albers
|
|
Foundations
|
Ministry
of Science and Technology of P. R. China (2018YFC0507300, 2019QZKK0405);
Shaanxi Province (2018JM4016)
|
|
Data publisher
|
Global
Change Research Data Publishing & Repository, http://www.geodoi.ac.cn
|
|
Address
|
No.
11A, Datun Road, Chaoyang District, Beijing 100101, China
|
|
Data
sharing policy
|
Data from
the Global Change Research Data Publishing & Repository includes metadata, datasets (in the Digital Journal of Global Change Data Repository), and
publications (in the Journal ofGlobal Change Data & Discovery). Data
sharing policy includes: (1) Data are openly available and can
be free downloaded via the Internet; (2) End users are encouraged to use Data
subject to citation; (3) Users, who are by definition also
value-added service providers, are welcome to redistribute Data
subject to written permission from the GCdataPR Editorial Office and the
issuance of a Data redistribution license; and (4) If Data
are used to compile new datasets, the ??ten percent principal?? should be
followed such that Data records utilized should not surpass 10%
of the new dataset contents, while sources should be clearly noted in
suitable places in the new dataset[10]
|
|
Communication and searchable system
|
DOI, DCI,
CSCD, WDS/ISC, GEOSS, China GEOSS, Crossref
|
This method can make use of
remote sensing data and methods conveniently, and has less input parameters, so
it has become one of the most popular NPP estimation models. The calculation equation is as
follows:
 (1)
(1)
where NPP is the Net Primary
Productivity (gC·m-2·a-1) of pixel x at time t, APAR is the photosynthetically
active radiation absorbed by vegetation (MJ·m-2·a-1), which is estimated by the total solar radiation (gC·m-2) of SOL and the absorption ratio of vegetation fraction
of photosynthetically active radiation (FPAR); and ?? is the efficiency of converting photosynthetically active
radiation into organic carbon (gC·MJ-2), which is calculated from the maximum light energy
utilization rate (??max, taken as 0.389 gC·MJ-2), temperature stress (T??) and water stress (W??).
Finally, the annual NPP is the sum of the NPP of
each month in the same year.
3.3 Technology Route
In this
study, we used remote sensing data, data from China meteorological station and
various products in the project. The technical route is shown in Figure 1. In CASA
model, APAR and ?? are the most
important parameters. As the driving factor of vegetation photosynthesis,
radiation data is determined by the total solar radiation and FPAR. Secondly, the actual and
potential evapotranspiration of the region were calculated by using the regional
actual evapotranspiration model proposed by Zhou[17]
and the complementary relationship proposed by Boucher[18]. And they
were used to describe the influence of available water conditions of vegetation
on ??. Compared with other models, the parameters
of the model are simple and is easy in operation. The influence of temperature
on ?? was calculated by NDVI and the optimal temperature derived from
monthly average temperature. Finally, APAR and ?? were used as the
input factors of CASA model to quantify the annual NPP of the study area.
4 Results and Assessment
4.1 Data
Results
|
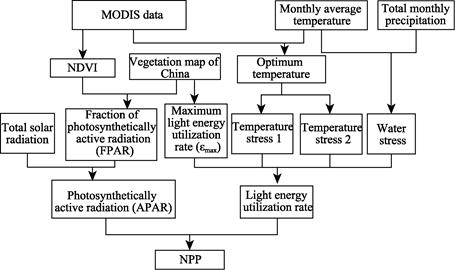
Figure 1 Technology route for development
of the dataset
|
Data NBZ_ NPP_ 1km_ 2000-2015 is
the annual NPP of national barrier zone in .tif format from 2000 to 2015. The
spatial resolution is 1-km, the unit is gC·m-2, and the projection coordinate system is WGS_1984_Albers, the total size
of compressed data is 53.8 MB. After decompressing, the data can be applied in
ArcGIS software.
The
spatial distribution of NPP at 1-km resolution in 2015 is shown in Figure 2.
The national barrier zone pans about 60 degrees in longitudes, and there are
obvious differences in climate between regions, so the spatial distribution of
NPP is quite different. In brief, the spatial distribution of NPP (2015) has
the characteristics of high in the southeast and low in the northwest, with
data range from 0-1,004 gC·m-2. The highest NPP was found in the southern hill
and mountain belt, followed by the ecological barrier of the Qinghai Tibet
Plateau, the northeastern forest zone and Sichuan Yunnan-Loess Plateau
ecological barrier, and the lowest NPP was found in the northern sand belt.
During the study period, NPP showed a slight upward trend (p=0.96).
From
2000 to 2015, the spatial variation of NPP in different regions was quite different.
It shows a significant increase trend in Sichuan Yunnan-Loess Plateau
ecological barrier and the northern sand belt (p<0.05), with an annual increase of 2.37 gC·m-2 and 1.25 gC·m-2, respectively; however, in the northeastern forest zone, it shows a
significant decrease trend (p<0.05),
with an annual decrease of 2.23 gC·m-2. And there was no significant change of NPP in other areas.
4.2 Accuracy Assessment
In order to verify the accuracy of NPP dataset, we carried
out the verification data collection from various sources. The validation data
is from NASA[19], and MODIS17A3 NPP data in 2000, 2005, 2010 and
2015 were selected. MRT (MODIS Reprojection Tool) software was used to
transform and calculate data. Each year, 54 data points were randomly
collected, with a total of 270 NPP values, which were compared with the results
of NPP data calculated
in
corresponding years in this paper (Figure 3). The results show that the difference
between
them was small (validation data range is 0-1,521.6 gC·m-2, simulation data range is 0-1,004.0 gC·m-2), the average deviation was about 260 gC·m-2, and the overall accuracy
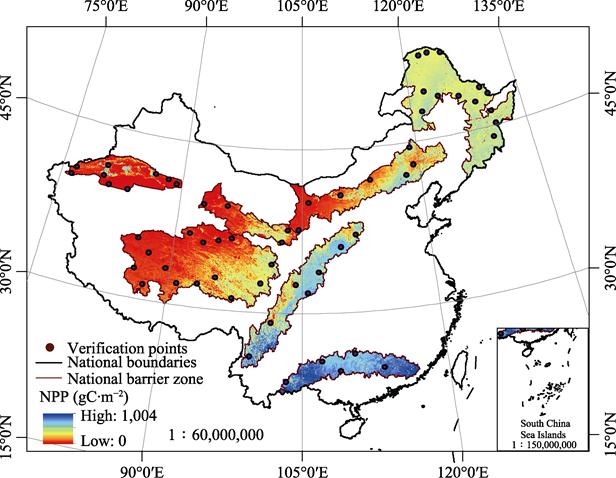
Figure 2 Map of national ecological barrier zone 1-km resolution NPP (2015)
|

Figure
3 Comparative analysis with MODIS17A3 NPP data (Note: the points in the
figure represent the comparison result with MODIS17A3 data, and the line
represents the linear fitting result between the two data)
|
(1 minus RMSE
divided by the average NPP simulation data) was 81.47%. It can be seen from
Figure 3 that the correlation between the validation value and the simulation
value is high (R2=0.94). Therefore, the NPP obtained under
the technical process of this paper have high accuracy, which can accurately reflect
the change trend of NPP in national barrier zone in recent years from a macro
perspective.
5 Conclusion
In order to construct the NPP time series product
of national barrier zone, based on the data of remote
sensing, meteorology and soil type to obtain photosynthetically active radiation
(APAR) and actual
light energy utilization rate (??), a modeling study of NPP was carried
out. Compared with the existing similar products, the dataset
has high accuracy and can meet the design objectives. The Net Primary
Productivity dataset of national barrier zone with
1-km spatial resolution from 2000 to 2015 shows the
spatial distribution of NPP in different periods. It is helpful to study the
ecosystem service under the background of global change and analyze the
evolution of spatiotemporal pattern of carbon cycle in national ecological barrier
area. The dataset can provide reliable basic data and information for
comprehensive understanding and grasping the security situation of national
ecological barrier area and sustainable development of ecosystem.
Author
Contributions
Wang, X. F. designed the overall dataset development,
designed the model and algorithm, did the data validation and wrote this data
paper, Wang, Y. collected and processed the NPP data and wrote this data paper.
Yin, L. C. collected and processed the NPP data.
References
[1]
Zhang, Y. L., Qi, W., Zhou, C. P., et al. Spatial and temporal
variability in the net primary production (NPP) of alpine grassland on Tibetan
Plateau from 1982 to 2009 [J]. Acta Geographica Sinica, 2013, 68(9):
1197-1211.
[2]
Mu, S. J., Li, J. L., Zhou, W., et al. Spatial-temporal
distribution of Net Primary Productivity and its relation with climate factors
in Inner Mongolia from 2001 to 2010 [J]. Acta Ecologica Sinica, 2013,
33(12): 3752-3764.
[3]
Zheng, Z. T., Zhu, W. Q., Zhang, Y. J. Seasonally and spatially varied
controls of climatic factors on Net Primary Productivity in alpine grasslands
on the Tibetan Plateau [J]. Global Ecology and Conservation, 2019, 21:
e00814.
[4]
Chen, Y.
Z., Tao, Y. W., Cheng, Y., et al. Great uncertainties in modeling
grazing impact on carbon sequestration: a multi-model inter-comparison in
Temperate Eurasian Steppe [J]. Environmental Research Letters, 2018,
13(7): 075005.
[5]
Crabtree, R., Potter, C., Mullen, R., et al. A modeling and
spatio-temporal analysis framework for monitoring environmental change using
NPP as an ecosystem indicator [J]. Remote Sensing of Environment, 2009,
113(7), 1486-1496.
[6]
Field, C.
B., Behrenfeld, M. J., Randerson, J. T., et al.
Primary production of the biosphere: integrating terrestrial and oceanic
components [J]. Science, 1998, 281(5374): 237-240.
[7]
IGBP
Terrestrials Carbon Working Group. The terrestrial carbon cycle: implications
for the Kyoto Protocol [J]. Science, 1998, 280(5368): 1393-1394.
[8]
Fu, B. J.,
Wang, X. F., Feng, X. M., et al. National Barrier Zone Ecosystem Assessment
[M]. Beijing: Science Press, 2016: 271-345.
[9]
Wang, X.
F., Wang, Y., Yin, L. C. 1-km NPP product in national barrier
zone of China (2000-2015) [J/DB/OL]. Digital
Journal of Global Change Data Repository, 2020. DOI:
10.3974/geodb.2020.03.10.V1.
[10]
GCdataPR Editorial Office. GCdataPR Data Sharing Policy [OL]. DOI:
10.3974/dp.policy.2014.05 (Updated 2017).
[11]
https://ladsweb.modaps.eosdis.nasa.gov/search/order/.
[12]
http://www.cma.gov.cn/.
[13]
Wang, X. F.
National ecological barrier zone [J/DB/OL]. Digital
Journal of Global Change Data Repository, 2020. DOI: 10.3974/geodb.2020.03.01.V1.
[14]
Wang, X.
F., Lesi, M. C., Zhang, M. M. Ecosystem pattern change and its influencing
factors of ??two barriers and three belts?? [J]. Chinese Journal of Ecology, 2019, 38(7): 2138-2148.
[15]
Yin, L. C.,
Wang, X. F., Zhang, K., et al. Trade-offs and synergy between ecosystem
services in national barrier zone [J]. Geographical
Research, 2019, 38(9): 2162-2172.
[16]
Potter, C.
S., Randerson, J. T., Field, C. B., et al.
Terrestrial ecosystem production: a process model based on global satellite and
surface data [J]. Global Biogeochemical Cycles, 1993, 7(4): 811-841.
[17]
Zhou, G. S., Zhang, X. S. A natural vegetation NPP model [J]. Chinese Journal of Plant Ecology, 1995, 19(3): 193-200.
[18]
Zhang, Z.
M. Principle and Method of Calculating Evaporation [M]. Chengdu: Chengdu
University of Science and Technology Press, 1990.
[19]
http://ladswed.nascom.nasa.gov/.