Coastline Classification Dataset of 25 Port Cities and Their Surrounding Areas along the B&R
Song, Y. 1, 2 Hou, X. Y.1*
1. Yantai Institute of Coastal Zone Research, Chinese Academy of Sciences, Yantai 264003, China;
2. University of Chinese Academy of Sciences, Beijing 100049, China
Abstract: This dataset focus on the delineation and classification of coastline in 25 port cities and its surrounding area along the Belt & Road (B&R). Landsat 8 OLI images in 2015 were used as basic data source, and the high-resolution remote sensing images such as Google Earth images were chosen as ancillary data. The 25 port cities are Shanghai, Busan, Singapore, Jakarta, Kyaukpyu, Bangkok, Kuantan, Mumbai, Gwadar, Kolkata, Chittagong, Colombo, Doha, Abbas, Jeddah, Dubai, Lisbon, Petersburg, Djibouti, Sudan-port, Alexandria, Piraeus, Istanbul, Sydney, and Darwin. The mean high tide line was chosen as the proxy of coastline. Coastline was first classified into natural and artificial coastline, and then seven subtypes of artificial coastline were further categorized: groin and jetty, harbor and wharf, reclamation, aquaculture dike, salt pan dike, traffic dike, and sea wall. Visual interpretation method was adopted to delineate and classify coastline in and adjacent to port cities. The result shows that, “Harbor and Wharf” and “Traffic dike” are common coastline in well developed port cities, such as Shanghai, Singapore, and Pusan; while natural coastline are widely distributed in newly developed port cities, such as Kyaukpyu, Gwadar, Kuantan, and Djibouti; the rest of port cities are significantly different from the above two types because both artificial and natural coastline could be found. The dataset is archived as .shp file, with the data size of 855 KB.
Keywords: Belt and Road; OBOR; port city; coastline; natural coastline; hardened coastline
1 Introduction
Based on the geographical distribution characters of global maritime economic activities[1–4], location advantages and development status of port cities[5–9], we choose 25 port cities for coastline classification. The dataset of the 25 port cities and their surrounding areas along the B&R[10] have been enrolled into the GEOARC-2015 by the National Remote Sensing Center of China (NRSCC), Ministry of Science and Technology.
2 Metadata of Dataset
The introduction of Coastline data in 25 port cities and its surrounding area along the Belt and Road (2015) consist of dataset full name, short name, authors, geographical region, time, data sharing policy, etc. The detailed description of the metadata is shown in Table 1.
Table 1 Summary of the metadata
|
Items
|
Description
|
|
Dataset full name
|
Coastline data in 25 port cities and its surrounding area along the B&R (2015)
|
|
Dataset short name
|
Coastline25CitiesB&R_2015
|
|
Authors
|
Song, Y. L-7245-2016, Yantai Institute of Coastal Zone Research, Chinese Academy of Science, ysong@yic.ac.cn
Hou, X. Y. L-6506-2016, Yantai Institute of Coastal Zone Research, Chinese Academy of Sciences, xyhou@yic.ac.cn
|
|
Geographical region
|
25 port cities and their surrounding areas, port cities including Shanghai, Busan, Singapore, Jakarta, Kyaukpyu, Bangkok, Kuantan, Mumbai, Calcutta, Chittagong, Gwadar, Colombo, Doha, Abbas, Dubai, Lisbon, Jeddah, St Petersburg, Djibouti, Port Sudan, Piraeus, Istanbul, Sydney, Alexander, and Darwin
|
|
Time
|
2015
|
|
Number of tiles
|
25
|
|
Data format
|
.shp
|
|
Data Size
|
855 KB
|
|
Dataset and data files
|
The dataset consist of the vector data of coastline of 25 port cities and their surrounding areas. The data of each city is archived in a single folder with .shp file. All data of 25 cities are compressed into one data file
|
|
Foundation
|
National Natural Science Foundation of China ( 31461143032 )
|
|
Data publisher
|
Global Change Research Data Publishing and Repository, http://www.geodoi.ac.cn
|
|
Address
|
No. 11A, Datun Road, Chaoyang District, Beijing 100101, China
|
|
Data sharing policy
|
Data from the Global Change Research Data Publishing & Repository includes metadata, datasets (data products), and publications (in this case, in the Journal of Global Change Data & Discovery). Data sharing policy includes: (1) Data are openly available and can be free downloaded via the Internet; (2) End users are encouraged to use Data subject to citation; (3) Users, who are by definition also value-added service providers, are welcome to redistribute Data subject to written permission from the GCdataPR Editorial Office and the issuance of a Data redistribution license; and (4) If Data are used to compile new datasets, the ‘ten per cent principal’ should be followed such that Data records utilized should not surpass 10% of the new dataset contents, while sources should be clearly noted in suitable places in the new dataset[11]
|
3 Methods
Many definitions of the coastline exist, and the selection of specific definitions will have an important impact on the results of the study. In this paper, the mean high water line, one of the most widely used proxy of coastline[12–13], were adopted. Cloudless Landsat 8 OLI images captured in 2015 (Table 2) were downloaded from USGS (http://glovis.usgs.gov/), and based on which visual interpretation method was adopted to delineate and classify coastlines.
According to their utilization status, the coastline data were classified into 8 categories, which are natural coastline, Groin and Jetty, Harbor and Wharf, Reclamation, Aquaculture dike, Salt pan dike, Traffic dike and Sea wall (Table 3).
Table 2 Landsat 8 OLI images used for coastline classification
|
Port cities
|
Date
|
Path/Row
|
Port cities
|
Date
|
Path/Row
|
|
Shanghai
|
2015/08/03
|
118/38
|
Port Sudan
|
2015/07/21
|
171/46
|
|
2015/08/03
|
118/39
|
2015/07/21
|
171/47
|
|
Busan
|
2015/06/04
|
114/35
|
Bangkok
|
2015/05/21
|
128/51
|
|
2015/06/04
|
115/35
|
2015/11/04
|
129/50
|
|
2015/05/27
|
115/35
|
2015/11/04
|
129/51
|
|
2015/05/27
|
115/36
|
2015/03/16
|
130/50
|
|
Dubai
|
2015/08/16
|
161/42
|
Jakarta
|
2015/08/31
|
122/64
|
|
2015/09/19
|
159/43
|
2015/09/23
|
123/64
|
|
2015/09/26
|
160/42
|
St Petersburg
|
2015/08/24
|
185/18
|
|
2015/09/26
|
160/43
|
2015/08/24
|
185/19
|
|
Alexander
|
2015/09/01
|
177/38
|
Abbas
|
2015/08/19
|
159/42
|
|
2015/09/24
|
178/38
|
2015/08/26
|
160/42
|
|
Calcutta
|
2015/11/19
|
138/44
|
Istanbul
|
2015/07/13
|
179/31
|
|
2015/11/19
|
138/45
|
2015/06/28
|
179/32
|
|
2015/10/25
|
139/44
|
2015/09/06
|
180/31
|
|
2015/10/25
|
139/45
|
2015/09/06
|
180/32
|
|
Jeddah
|
2015/09/25
|
169/44
|
2015/08/28
|
181/31
|
|
2015/09/16
|
170/45
|
Chittagong
|
2015/11/05
|
136/44
|
|
2015/09/16
|
170/46
|
2015/10/20
|
136/45
|
|
2015/09/16
|
170/47
|
Mumbai
|
2015/10/08
|
148/46
|
|
Lisbon
|
2015/06/26
|
204/33
|
2015/10/08
|
148/47
|
|
Doha
|
2015/08/23
|
162/42
|
Gwadar
|
2015/09/07
|
155/43
|
|
2015/08/23
|
162/43
|
Darwin
|
2015/05/11
|
106/68
|
|
Singapore
|
2015/06/01
|
125/59
|
2015/05/27
|
106/69
|
|
Sydney
|
2015/02/28
|
89/83
|
Kuantan
|
2015/07/26
|
126/58
|
|
2015/02/28
|
89/84
|
Piraeus
|
2015/08/19
|
182/34
|
|
Colombo
|
2015/01/08
|
141/55
|
2015/07/09
|
183/33
|
|
2015/02/25
|
141/56
|
2015/07/09
|
183/34
|
|
Kyaukpyu
|
2015/11/23
|
134/47
|
Djibouti
|
2015/10/06
|
166/52
|
Table 3 Categories of coastline in port cities and their surrounding areas
|
Types
|
Code
|
Description
|
|
Natural coastline
|
1
|
Undeveloped coastline without any form of dike
|
|
Hardened coastline
|
Groin and Jetty
|
11
|
Groin: low wall built out into the sea obliquely to prevent it from washing away sand and stones from beaches and regulate alongshore current
Jetty: a wall built out into the sea with one side on shore for wave defending
|
|
Harbor and Wharf
|
12
|
Hardened wall that belong to harbor and wharf
|
|
Reclamation
|
13
|
Districts that is being reclaimed
|
|
Aquaculture dike
|
14
|
Dikes built for aquaculture
|
|
Salt pan dike
|
15
|
Dikes built for salt extraction
|
|
Traffic dike
|
16
|
Dikes built for traffic, including sea walls with traffic functions
|
|
Sea wall
|
17
|
Other coastal protection projects that separate land from water
|
4 Quality Control and Validation of Coastline Data
The Coastline data in 25 port cities and its surrounding area along the Belt and Road in 2015 shows that total length is 11,347.30 km, among which, the coastline length of natural coastline, groin and jetty, harbor and wharf, reclamation, aquaculture dike, salt pan dike, traffic dike and sea wall is 11,347.30 km, 532.33 km, 1,467.64 km, 320.72 km, 11.91 km, 127.28 km, 1,300.84 km and 548.83 km, respectively. The natural coastline, accounted for 62.02%, is major coastline in 25 port cities and their surrounding areas. The statistics of coastline length in 25 port cities and their surrounding areas is shown in Table 4.
The dataset consist of the coastline vector data of 25 port cities and their surrounding areas. The data of each city is archived in a single folder with .shp format. Field survey along Shanghai coastline has been conducted in 2013.The coastline delineation and classification results in Shanghai are more reliable because most of its coastlines have been hardened. During the process of coastline delineation and classification, high-resolution images of Google Earth have been referenced in order to improve the reliability of the result as much as possible. Google Earth images and coastline results of selected port cities, are shown in Figure 1-2 (Busan), Figure 3-4 (Bangkok), Figure 5-6 (Mumbai), Figure 7-8 (Jeddah), Figure 9-10 (Alexander), Figure 11-12 (Lisbon), and Figure 13-14 (Sydney).


Figure 1 Google Earth images of Busan Figure 2 Coastline classification of Busan
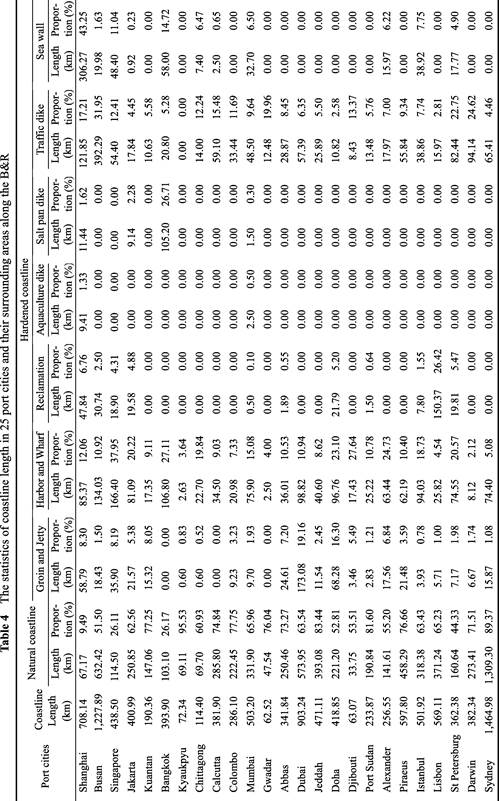
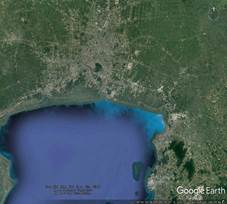
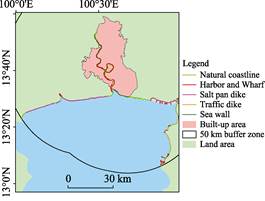
Figure 3 Google Earth images of Bangkok Figure 4 Coastline classification of Bangkok
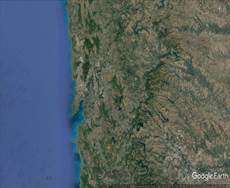
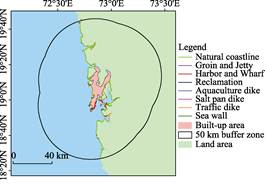
Figure 5 Google Earth images of Mumbai Figure 6 Coastline classification of Mumbai
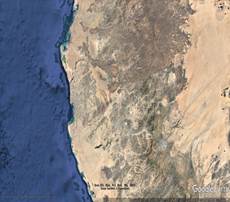

Figure 7 Google Earth images of Jeddah Figure 8 Coastline classification of Jeddah
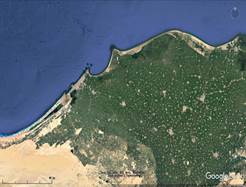
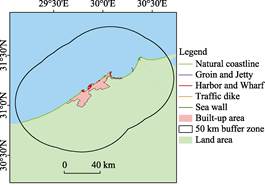
Figure 9 Google Earth images of Alexander Figure 10 Coastline classification of Alexander
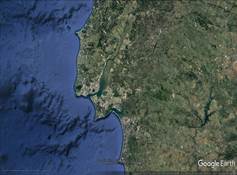
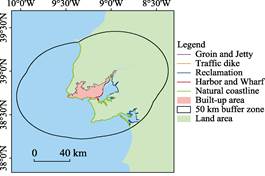
Figure 11 Google Earth images of Lisbon Figure 12 Coastline classification of Lisbon
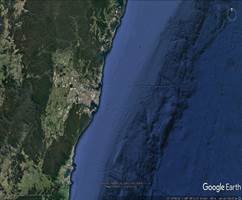
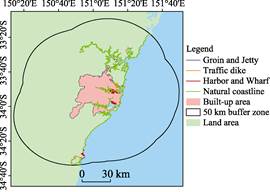
Figure 13 Google Earth images of Sydney Figure 14 Coastline classification of Sydney
Author Contributions
Overall plan and technical framework of this dataset was designed by Hou, X. Y. Landsat 8 OLI images were processed and analyzed by Song, Y.
Acknowledgements
This work has been finished as part of the Global Ecosystems and Environment Observation: Annual Report from China (GEOARC-2015), and special thanks goes to leadership and staff in the National Remote Sensing Center of China (NRSCC), Ministry of Science and Technology of the People’s Republic of China. At the same time, more thanks to Wang,Y. D., Liu, J., Wang, J. H., Wei, L. S., Wang, X. L., and Hou, W. for their contributions and valuable suggestions during this work.
References
[1] Zhou, M. World Atlas of Port Traffic [M]. Beijing: Sinomaps Press, 2013.
[2] Fan, Y., Zhou, M. Atlas of the World [M]. Beijing: Sinomaps Press, 2013.
[3] China Communications Press Co., Ltd. World Atlas [M]. Beijing: China Communications Press Co., Ltd., 2014.
[4] Zhao, Y. P. The Evolution of International Port Function and the Construction of Internationally Important Port [M]. Beijing: Economic Science Press, 2013.
[5] Chen, H., Luan, W. X. Theoretical and Empirical Study on the Interaction between Port and City [M]. Beijing: Economic Science Press, 2010.
[6] Wang, C. J. Research prospect and progress of modern port geography [J]. Advances in Earth Science, 2008, 23(3): 243–250.
[7] Wang, L., Wang, N., Tong, S. Q. Research on coordinated development degree between port and urban environment and resource [J]. Navigation of China, 2008, 31(4): 410–414.
[8] Guo, J. K., Han, Z. L. Review and prospect of the research on spatial connection between port and city [J]. Progress in Geography, 2010, 29(12): 1490–1498.
[9] Wang, H. Q., Liu, H., Wang, J. H. Three aspects and prospect of the relation research between port and city [J]. Ocean Development and Management, 2013, 30(4): 52–57.
[10] Song, Y., Hou, X. Y. Coastline data in 25 port cities and its surrounding area along the B&R (2015) [DB/OL]. Global Change Research Data Publishing & Repository, 2016. DOI: 10.3974/geodb.2016.03.04.V1.
[11] GCdataPR Editorial Office. GCdataPR Data Sharing Policy [OL]. DOI: 10.3974/dp.policy.2014.05 (Updated 2017).
[12] Hou, X. Y., Wu, T., Wang, Y. D., et al. Extraction and accuracy evaluation of multi-temporal coastlines of mainland China since 1940s [J]. Marine Sciences, 2014, 38(11): 66–73. DOI: 10.11759/hykx 20131217001.
[13] Hou, X. Y., Wu, T., Wang, Y. D., et al. Characteristics of coastline changes in mainland China since the early 1940s [J]. Science China: Earth Science, 2016, 46: 1065–1075. DOI: 10.1360/N072015-00268.