Development of the Grid
Dataset of High-
Temperature
Days and Types in Southern
China (1983?C2017)
Jia, Z. K.1 Zheng, Z. H.1,2* Feng, G. L.1,2
1. College of Atmospheric
Science, Lanzhou University, Lanzhou 730000, China;
2. Laboratory for Climate Studies,
National Climate Center, China Meteorological Administration, Beijing
100081, China
Abstract: In the context
of global warming, high-temperature events have shown a clear increasing trend,
and most parts of China are deeply affected by high temperatures (HTs). The
high-temperature day (HTD) data can reflect the characteristics of HT changes,
it is one of the most important data types used in HT research. A dataset of
HTDs in China and midsummer high-temperature types (HTTs) in Southern China (SC)
was developed based on daily maximum temperature data recorded from 2,374
meteorological stations during June to September and midsummer HT data
collected from 750 stations in SC during 1983?C2017. The dataset includes (1) 0.5?? raster data of
the annual number of HTDs in China; (2) 0.5?? raster data of
the average annual HTDs in China; (3) 0.5?? raster data of the trend
of HTDs in China; (4) 0.5?? raster data of the spatial pattern of HTTs
in SC in midsummer; (5) statistical data of the interannual variations in HTDs
from June to September in SC; and (6) statistical data of the interannual
variations in HTTs in SC in midsummer. This dataset is archived in .nc and .txt
formats and is composed of 6 data files, with a data size of 2.43 MB
(compressed into one file, 554 KB).
Keywords: Chinese high
temperature; clustering analysis; raster data; 1983?C2017
DOI: https://doi.org/10.3974/geodp.2021.02.03
CSTR: https://cstr.escience.org.cn/CSTR:20146.14.2021.02.03
Dataset Availability
Statement:
The dataset supporting
this paper was published and is accessible through the Digital Journal of
Global Change Data Repository at: https://doi.org/10.3974/geodb.2021.01.06.V1 or https://cstr.escience.org.cn/CSTR:20146.11.2021.01.06.V1.
1
Introduction
In the context of global warming and climate change,
extreme high-temperature events (EHTEs) have shown a clear increasing trend.
Due to their huge impacts on human health, the aggravation of energy consumption,
and the destruction of the environment, EHTEs have attracted much attention in
recent years[1?C4]. Based on the June?CSeptember daily maximum
temperature data of 2,374 surface meteorological stations in China from 1983 to
2017, the absolute threshold of the daily maximum temperature exceeding 35??C is
used to define the high-temperature days (HTDs). This study calculated the
number of HTDs in China and the corresponding annual average and trend to
improve the understanding of the frequency and the spatial pattern of trend
associated with high temperatures in China.
Southern China (SC) is region of densely populated,
economically prosperous, and highly susceptible to EHTEs[5]. At the
same time, its vast area and complex climatic conditions have influenced the
diversity of EHTEs and the diversification of weather and climate influencing
factors. In general research, it is easy to obscure the characteristics of different EHTEs[6,7]. Clustering
analyses can effectively solve the above-described problems, extract the
characteristics of different high-temperature (HT) categories, and provide a
theoretical basis for analyzing the causes of HTs to improve HT forecasting[8].
This dataset provides the spatial patterns of classified EH in SC and the
statistical data of various types of interannual variations, to reflect the
characteristics of HT diversity in SC well.
2
Metadata of the Dataset
The metadata of the Grid dataset of high temperature days
and types in China (1983?C2017)[9] is summarized in Table 1. It
includes the dataset full name, short name, authors, year of the dataset,
spatial resolution, data format, data size, data files, data publisher, and
data sharing policy, etc.
Table 1
Metadata summary of the Grid
dataset of high temperature days and types
in China (1983?C2017)[9]
|
Items
|
Description
|
|
Dataset full name
|
Grid dataset of high
temperature days and types in China (1983?C2017)
|
|
Dataset short name
|
HDs_1983-2017
|
|
Authors
|
Jia, Z. K., College of
Atmospheric Science, Lanzhou University, China jiazk17@lzu.edu.cn
Zheng, Z. H., College of Atmospheric
Science, Lanzhou University,, China zhengzh@cma.gov.cn
Feng, G. L., Laboratory for
Climate Studies, National Climate Center, China Meteorological
Administration, fenggl@cma.gov.cn
|
|
Year
|
1983?C2017
Spatial resolution 0.5??
|
|
Data format
|
.nc, .txt
Data size
554 KB
|
|
Data files
|
Composed of 4 .nc files and 2
.txt files
|
|
Data publisher
|
Global Change Research Data
Publishing & Repository, http://www.geodoi.ac.cn
|
|
Address
|
No. 11A, Datun Road, Chaoyang
District, Beijing 100101, China
|
|
Data sharing policy
|
Data from the Global Change
Research Data Publishing & Repository includes metadata, datasets (in the
Digital Journal of Global Change Data Repository), and publications (in
the Journal of Global Change Data & Discovery). Data
sharing policy includes: (1) Data are openly available and
can be free downloaded via the Internet; (2) End users are encouraged to use Data
subject to citation; (3) Users, who are by definition also value-added
service providers, are welcome to redistribute Data subject to
written permission from the GCdataPR Editorial Office and the issuance of a Data
redistribution license; and (4) If Data are used to compile new
datasets, the ??ten per cent principal?? should be followed such that Data
records utilized should not surpass 10% of the new dataset contents, while
sources should be clearly noted in suitable places in the new dataset[10]
|
|
Communication
and searchable system
|
DOI, CSTR, Crossref, DCI,
CSCD, CNKI, SciEngine, WDS/ISC, GEOSS
|
3
Data Development Method
The basic data used in this research were the homogenized
daily maximum temperature data of 2,374 surface meteorological stations in
China released by the National Meteorological Information Center of the China
Meteorological Administration. NCL (NCAR command language) was used to detect
and process the missing values of the data. Finally, station data covering the
35 years from 1983 to 2017 were selected for this research. The absolute value
definition method with the maximum temperature exceeding 35 ??C was used to
define the HTDs of each station, and the number of HTDs from June to September
at all stations were then summed to obtain the annual HTD dataset in China.
Next, the arithmetic average method and linear tendency estimation method were
used to obtain the annual average and trend. The inverse distance weight
interpolation method of NCL was used to interpolate the above-described data to
generate 0.5????0.5?? raster data.
In SC (east of 108??E and south of 33??N), more than 1/3 of
the total stations that recorded daily maximum temperatures over 35 ??C were
defined as regional HTDs, and the interannual variation data of the HTDs in SC
were obtained. The progressive clustering method was used to classify the EH in
SC. By considering the anomalous temperature data of each EHD as a vector and
assuming, there are N vectors in total. In the first step, the two vectors with
the smallest Euclidean distance were combined to the first category, the
average value was taken as the center of the category, and N?C1 vectors were
obtained; in the second step, the above operation was repeated to obtain N?C2
vectors; finally, the HT was divided into one category in step n?C1. The results
obtained based on some comprehensive analysis could be conducive to the next
analysis by dividing HT into three types[11]. The three types of HT
differ greatly in their center positions, relative strengths and ranges. Thus,
the raster data of three types of high-temperature patterns and the
corresponding annual frequency data were obtained.
4
Data Results and Validation
4.1
Data Composition
The dataset developed in this study consists of the
following data: (1) raster data of annual high-temperature days in China from
1983 to 2017; (2) raster data of average annual high-temperature days in China;
(3) raster data of the trend of high-temperature days in China; (4) raster data
of the spatial patterns of high-temperature anomaly classifications in Southern
China in midsummer; (5) statistical data of interannual variations in
high-temperature days from June to September in Southern China from 1983 to
2017; (6) statistical data of interannual variations in high-temperature days
of various types in Southern China in midsummer.
A total of 4 raster datasets were interpolated from station
data to 0.5????0.5?? raster data, and the storage format was .nc; 2 interannual
variation datasets were obtained, and the storage format of these datasets was
.txt.
4.2
Data Results
To facilitate the introduction of the climate state and
trends in HTDs in China, the annual average and trend of HTDs were visualized.
According to the mean value, eastern Xinjiang and southeastern China represent
the areas with frequent HTDs, with the average number of HTDs exceeding 20 d in
a year. The average annual HTDs in North China were close to 10 d, while HTDs
rarely occurred in the remaining regions[12]. The trend distribution
was similar to the mean value, with a strong increasing trend in Xinjiang and
SC, where high temperatures occurred frequently, and a trend greater than 5
d/10a in the central region, while a decreasing trend did not appear anywhere
in China. From the perspective of the average values and trends, EHTEs will
continue to be the main meteorological and climatic disaster in China in the
future (Detailed results can be found in the references [12]).
It can be seen from Figure 1 that regional HTDs in SC had
an obvious increasing trend and were mainly concentrated in the midsummer
period (July and August). July was the month with the highest frequency of HTs,
followed by August, and the number of HTDs in some years exceeded the number of
days in July. Although there were few high-temperature days in June or
September, there was an obvious change over the study period. There was only
one HTD in the first decade, but there were two HTDs per year on average in the
last decade; this change was strongly correlated with global temperature
changes and the increasing frequency of extreme events[12].
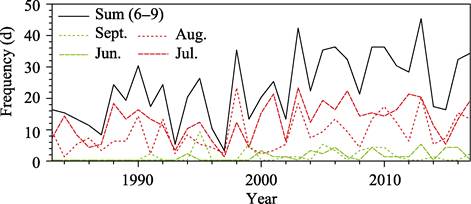
Figure 1 Interannual variations in regional
high-temperature days from June to September in Southern China
Based on clustering
analysis, the HTs in midsummer in SC were divided into three types: Jianghuai type
(JHT), South China type (SCT) and Central China type (CCT)[12]. The
central area of JHT is the Jianghuai region, which has the strongest relative
intensity and the widest range among the three types. Figure 2 shows that the
JHT high temperatures are also the highest-frequency category, accounting for
more than 56% of the HTs in midsummer, and the growth trend is obvious. In
2013, the highest occurrence of JHT high temperatures was observed, which
coincided with the continuous EHTE in the middle and lower reaches of the
Yangtze River in 2013[7,13]; SCT high temperatures were located in
South China, and negative temperature anomalies were observed in the northern
region of the Yangtze River, with the lowest occurrence frequency. The year
2003 represented a typical year, in line with
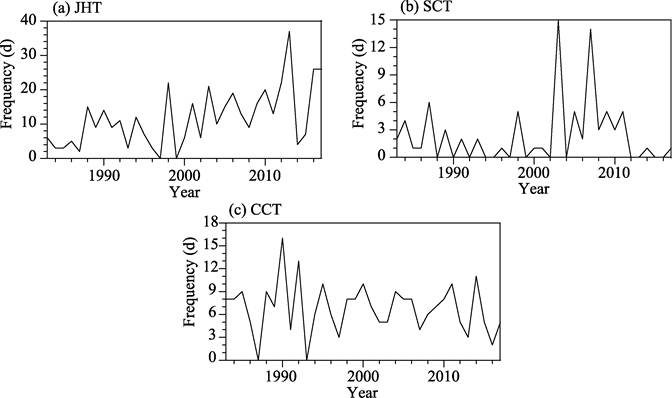
Figure
2 Interannual variation in
high-temperature days for JHT, SCT, and CCT
the characteristics of long-duration high temperatures in
SC in 2003[7,14]. The center of CCT is in Hunan and Hubei provinces,
where the relative intensity of HTs is the weakest and the frequency of
occurrence is higher. The circulation characteristics and external forcing
factors of the three high-temperature types are also significantly different [12].
5
Conclusion
In this study, the daily maximum temperature data of
meteorological surface stations in China were used to obtain data of annual
HTDs in China using the absolute threshold definition, and normalized raster
data were obtained by the inverse distance weighted interpolation method. It is
very important to study the spatial distribution and trend change of HTs in
China. The increasing trend of HTs indicates that EHTEs will be an important
extreme weather and climate event affecting China in the future. Determining
how to prevent and reduce HT damage has become an important field of
meteorological research. The progressive cluster analysis method was used to
classify and analyze the HTs in SC, and three types of HTs with different
characteristics were obtained along with their interannual variations to
provide a way of thinking for further analyses of HT characteristics. Analyses
of the causes of circulation and the external forcing factors of HT diversity
will be beneficial for improving high-temperature forecasts.
Author Contributions
Zheng, Z.
H. and Feng, G. L. provided the overall idea of the dataset development and the
revision of the data in the paper; Jia, Z. K. completed the processing of the
dataset and wrote the paper.
Conflicts of Interest
The authors declare no
conflicts of interest.
References
[1]
IPCC. Climate change 2013: the physical science basis [R]. Cambridge
University Press, 2013: 1535, https://doi.org/10.1017/CBO9781107415324.
[2]
Alexander,
L. V., Zhang, X. B., Peterson, T. C., et al. Global observed changes in
daily climate extremes of temperature and precipitation [J]. Journal of
Geophysical Research, 2006, 111: D05109.
[3]
Easterling,
D. R. Climate extremes: observations, modeling, and impacts [J]. Science,
2000, 289(5487): 2068?C2074.
[4]
Papalexiou, S. M., Aghakouchak, A., Trenberth, K. E., et al.
Global, regional, and megacity trends in the highest temperature of the year:
diagnostics and evidence for accelerating trends [J]. Earths Future,
2018, 6(1): 71?C79.
[5]
Dong, S.
Y., Sun, Y., Aguilar, E., et al. Observed changes in temperature
extremes over Asia and their attribution [J]. Climate Dynamics, 2018,
51: 339?C353.
[6]
Chen, R.
D., Lu, R. Comparisons of the circulation anomalies associated with extreme
heat in different regions of Eastern China [J]. Journal of Climate,
2015, 28(14): 5830?C5844.
[7]
Deng, K.
Q., Yang, S., Ting, M. F., et al. Dominant modes of China summer heat
waves driven by global sea surface temperature and atmospheric internal
variability [J]. Journal of Climate, 2019, 32: 3061?C3075.
[8]
St??fanon,
M., Fabio D., Drobinski, P. Heatwave classifcation over Europe and the
Mediterranean region [J]. Environmental Research Letters, 2012, 7(1):
014023.
[9] Jia, Z. K., Zheng, Z. H., Feng, G. L. Grid dataset of high
temperature days and types in China (1983?C2017) [J/DB/OL]. Digital Journal
of Global Change Data Repository, 2021. https://doi.org/10.3974/geodb.2021.01.06.V1. https://cstr.escience.org.cn/CSTR:20146.11.
2021.01.06.V1.
[10] GCdataPR
Editorial Office. GCdataPR data sharing policy [OL].
https://doi.org/10.3974/dp.policy.2014.05 (Updated 2017).
[11]
Wang, P. Y., Tang, J. P., Wang, S. Y., et al. Regional heatwaves in
China: a cluster analysis [J]. Climate Dynamics, 2018, 50: 1901?C1917.
[12] Jia, Z. K.,
Zheng, Z. H., Feng, G. L. Midsummer High Temperature Types in Southern China
and their corresponding large-scale circulation and sea surface temperature
anomalies [J]. Acta Meteorologica Sinica, 2020,78(6): 1?C17.