Content and Composition of the Global Land
Surface Water Dataset at 30 m Resolution (2010)
Chen, J.1 Liao, A. P.1 Chen, L. J.1* Zhang, H. W.1 He, C. Y.1 Peng, S.1
Wu, H.1 Zhang, W. W.1 Li, R.1 Zheng, X. Y.1 Mei, Y.1 Lu, M.1 Lu, N.1
Kang, R.1 Xing, H. Q.1 Liu, L. F.1, 2 Han, G.1, 2 Wang, J.2 Yang, A. L.3
Sun, L. M.3 Song H.3 Chen, W. P.4 Zhou, X. M.4 Xia, L.4 Jiang, H. B.5
Huo, J.5 Zhang, Y.5 Liu, W. D.5 Li, Y. X.5 Zhai, L.6 Sang, H. Y.6
1. National Geomatics Center of China, Beijing 100830, China;
2. Geo-Compass Geoinformation Technology Company, Beijing 100048, China;
3. Heilongjiang Geomatics Center of NASG, Harbin 150086, China;
4. The First Institute of Photogrammetry and Remote Sensing, National Administration of Surveying, Mapping and Geoinformation of China (NASG), Xi’an 710054, China;
5. Sichuan Surveying and Mapping Institute of Remote Sensing Information, Chengdu 610100, China;
6. Chinese Academy of Surveying and Mapping, Beijing 100830, China
Abstract: The Global Land Surface Water Dataset at 30 m Resolution (2010) (GlobeLand30- WTR2010) was developed based on 9,907 Landsat TM5 and ETM+ image and 2,640 Chinese Environment Disaster Mitigation Satellite (HJ-1) images around 2010. The global dataset was divided into 759 frames, each comprising a data file that encompasses four files: (1) an entity data file (in GeoTIFF raster format), (2) a coordinate information file (in TIFF WORD format), (3) a classified elementary image map file (a shape file format vector layer file that records scope per scene and the acquisition time of the main images used in the classification, and (4) a metadata file (XML format). The dataset also includes an additional attached file which lists data file names, geographic coordinates, zoning codes, and other information included within the 759 data file sets. The data development methodology and standards were descripted at the paper.
Keywords: global land cover; land surface water; 30 m resolution; classification method; remote sensing mapping
1 Introduction
Areas of surface water include rivers, lakes, and reservoirs, as well as seasonal cover. Although land area covered by freshwater encompasses just 0.3% of this resource globally, comprising just 0.01% of the total water in the world, freshwater is nevertheless the major source for production and life in many regions, as well as one of the most important resources for human survival and development. In addition, areas of land surface water make up a major component of the global water cycle. The spatial distribution of these resources reflects the location of reservoirs and water utilization on the land surface globally[1–2], while observed variations are indicative of the continuous impacts of moisture movement, migration of chemical substances, and changes in ecological systems that result from climate fluctuations, land surface processes, and human activities[3–4]. As a result, it remains fundamental to comprehensively understand the spatial distribution of land surface water resources and to continuously monitor dynamic changes in order to diagnose the health of the global ecological system.
Thus, supported by the ‘Global Land Cover Remote Sensing Mapping and Key Technical Research’ project as part of the National High Technology Research and Development Program, China was at the forefront of high-resolution global land cover remote sensing (RS) mapping by 2009[5–6]. Utilizing RS data at 30 m resolution, complemented by data at 250 m resolution, the aim of this project was to develop a global land cover data product by 2010 (GlobeLand30-2010)[7]. The dataset presented in this paper is the land surface water area data (GlobeLand-Water2010) that was generated by this project [7–8].
2 Metadata of Dataset
The summaries of the GlobeLand30-WTR2010 metadata are presented in Table 1 and Table 2, which include the information about the dataset title, abbreviated name, author, geographic area, data year, data spatial resolution, data publisher, and data policy.
Table 1 List of GlobeLand30-WTR2010 dataset authors
|
Serial No.
|
Name
|
ResearcherID
|
Organization
|
Contact information
|
|
1
|
Chen Jun
|
C-7025-2017
|
National Geomatics Center of China
|
chenjun@nsdi.gov.cn
|
|
2
|
Liao Anping
|
C-7538-2017
|
National Geomatics Center of China
|
lap@nsdi.gov.cn
|
|
3
|
Chen Lijun
|
L-4546-2016
|
National Geomatics Center of China
|
chenlj@nsdi.gov.cn
|
|
4
|
Zhang Hongwei
|
C-9720-2017
|
National Geomatics Center of China
|
zhhw@nsdi.gov.cn
|
|
5
|
He Chaoying
|
C-9259-2017
|
National Geomatics Center of China
|
hechying@nsdi.gov.cn
|
|
6
|
Peng Shu
|
C-7357-2017
|
National Geomatics Center of China
|
pengshu@nsdi.gov.cn
|
|
7
|
Wu Hao
|
C-6761-2017
|
National Geomatics Center of China
|
wuhao@nsdi.gov.cn
|
|
8
|
Zhang Weiwei
|
C-8073-2017
|
National Geomatics Center of China
|
zww9820@126.com
|
|
9
|
Li Ran
|
C-6806-2017
|
National Geomatics Center of China
|
liran@nsdi.gov.cn
|
|
10
|
Zheng Xinyan
|
C-6703-2017
|
National Geomatics Center of China
|
xinyan_zheng@nsdi.gov. cn
|
|
11
|
Mei Yang
|
C-9249-2017
|
National Geomatics Center of China
|
meiyang81@163.com
|
|
12
|
Lu Miao
|
C-7372-2017
|
National Geomatics Center of China
|
lumiao0616@163.com
|
|
13
|
Lu Nan
|
C-6796-2017
|
National Geomatics Center of China
|
ln901105@163.com
|
|
14
|
Kang Rui
|
C-9208-2017
|
National Geomatics Center of China
|
295672415@qq.com
|
|
15
|
Xing Huaqiao
|
C-6845-2017
|
National Geomatics Center of China
|
xinghuaqiao@126.com
|
|
16
|
Liu Lifen
|
C-7320-2017
|
Geo-Compass Geoinformation
Technology Company
|
liulf@nsdi.gov.cn
|
|
17
|
Han Gang
|
C-6835-2017
|
Geo-Compass Geoinformation
Technology Company
|
hgbj0001@gmail.com
|
|
18
|
Wang Jing
|
C-7381-2017
|
Geo-Compass Geoinformation
Technology Company
|
wangjingqzy@sina.com
|
|
19
|
Chen Weiping
|
C-9743-2017
|
The First Institute of Photogrammetry and Remote Sensing, National Administration of Surveying, Mapping and Geoinformation of China (NASG)
|
cwpsc@163.com
|
(To be continued on the next page)
(Continued)
|
Serial
No.
|
Name
|
ResearcherID
|
Organization
|
Contact information
|
|
20
|
Zhou Xiaomin
|
C-9441-2017
|
The First Institute of Photogrammetry and Remote Sensing, National Administration of Surveying, Mapping and Geoinformation of China (NASG)
|
410426390@qq.com
|
|
21
|
Xia Lu
|
C-9417-2017
|
The First Institute of Photogrammetry and Remote Sensing, National Administration of Surveying, Mapping and Geoinformation of China ( NASG)
|
46103337@qq.com
|
|
22
|
Yang Ailing
|
C-6817-2017
|
Heilongjiang Geoinformatics Center of NASG
|
172323001@qq.com
|
|
23
|
Sun Limei
|
C-7480-2017
|
Heilongjiang Geoinformatics Center of NASG
|
sunlm@hljbsm.gov.cn
|
|
24
|
Song Hao
|
C-7459-2017
|
Heilongjiang Geoinformatics Center of NASG
|
8465509@qq.com
|
|
25
|
Jiang Hongbing
|
C-9332-2017
|
Sichuan Surveying and Mapping Institute of Remote Sensing Information
|
scrsygy@sina.com
|
|
26
|
Huo Jian
|
C-7291-2017
|
Sichuan Surveying and Mapping Institute of Remote Sensing Information
|
scrsygy@sina.com
|
|
27
|
Zhang Yan
|
C-9230-2017
|
Sichuan Surveying and Mapping Institute of Remote Sensing Information
|
zhangyanyan917@163.com
|
|
28
|
Liu Wudi
|
C-8352-2017
|
Sichuan Surveying and Mapping Institute of Remote Sensing Information
|
308876585@qq.com
|
|
29
|
Li Yuxian
|
C-8324-2017
|
Sichuan Surveying and Mapping Institute of Remote Sensing Information
|
20933167@qq.com
|
|
30
|
Zhai Liang
|
C-7364-2017
|
Chinese Academy of Surveying and Mapping
|
zhailiang@casm.ac.cn
|
|
31
|
Sang Huiyong
|
C-8187-2017
|
Chinese Academy of Surveying and Mapping
|
sanghy@casm.ac.cn
|
Table 2 GlobeLand30-WTR2010 dataset metadata summary
|
Items
|
Description
|
|
Dataset full name
|
Global land surface water dataset at 30 m resolution
|
|
Dataset short name
|
GlobeLand30-WTR2010
|
|
Geographical region
|
Land of global (Antarctica not included)
|
|
Year
|
2010
|
|
Spatial resolution
|
30 m
|
|
Temporal resolution
|
1 year
|
|
Data formats
|
.rar, .tif, .tfw, .shp, .xml, .exl
|
|
Data size
|
8 GB
|
|
Data files
|
853 zipped data files, each of which contains four subfiles, in .tif, .tfw, .shp and .xml formats. An additional data file is also included that contains the name of the data file, corresponding geographic coordinates, and tile code (in .exl format)
|
|
Foundation (s)
|
Ministry of Science and Technology of P. R. China (2013AA122802, 2009AA1200, 2009AA122003); National Natural Science Foundation of China (41231172)
|
|
Data publisher
|
Global Change Research Data Publishing & Repository, http://www.geodoi.ac.cn
|
|
Address
|
No. 11A, Datun Road, Chaoyang District, Beijing 100101, China
|
|
Data sharing policy
|
Data from the Global Change Research Data Publishing & Repository includes metadata, datasets (data products), and publications (in this case, in the Journal of Global Change Data & Discovery). Data sharing policy includes: (1) Data are openly available and can be free downloaded via the Internet; (2) End users are encouraged to use Data subject to citation; (3) Users, who are by definition also value-added service providers, are welcome to redistribute Data subject to written permission from the GCdataPR Editorial Office and the issuance of a Data redistribution license; and (4) If Data are used to compile new datasets, the ‘ten per cent principal’ should be followed such that Data records utilized should not surpass 10% of the new dataset contents, while sources should be clearly noted in suitable places in the new dataset[9]
|
3 Methods
3.1 Definition of Terms
In this paper, the term ‘land surface water’ is used to refer to all surface water including rivers, lakes, reservoirs, and ponds, with the exception of farmlands (paddy fields), wetlands, multi-year snow cover, and glaciers.
Due to the existing mapping requirements for water areas, including 1??100,000 and
1??250,000 topographic schemes[10–11], we calculated a number of indexes to extract global land surface water areas (Table 3) via analysis of the expressive ability of images at 30 m resolution. Thus, because of the presence of mixed pixels in 30 m resolution RS images, planar water areas were mostly mapped using indexes from 1??100,000 topographic maps, with the minimum spot pattern for manual verification defined as 3 × 3 pixels (equivalent to 90 × 90 m2 in actuality). Similarly, in the case of linear water areas, the minimum width of manual verification is three pixels (equivalent to 90 m in actuality). Care was taken to ensure that central pixels were non-mixed to enhance the extraction accuracy of water areas.
Table 3 Comparisons between GlobeLand30-WTR2010 extraction indexes and
topographic map requirements
|
|
Requirements of 1??100,000 topographic maps
|
Requirements of 1??250,000 topographic maps
|
Water area extraction indexes
used in this project
|
|
Mapping requirements
|
Actual size
|
Mapping
requirements
|
Actual size
|
Index
|
Actual size
|
|
Linear water area
|
0.4 mm
|
40 m
|
0.4 mm
|
100 m
|
3 pixels
|
90 m
|
|
Planar water area
|
1 mm2
|
100 × 100 m2
|
1 mm2
|
250 × 250 m2
|
3 × 3 pixels
|
90 × 90 m2
|
In addition, for the quality control, we keep the water areas smaller than the minimum spot pattern, if it is possible. In light of regional differences in areas of land surface waters when viewed from a global perspective, we also formulated a number of quality control indexes for the extraction of areas of water.
3.2 Selection of Remote Sensing Images
The images that were classified for the development of the GlobeLand30-WTR2010 dataset are predominantly multi-spectral and have a 30 m resolution. These include 9,907 scenes from the United States land resource satellite (Landsat) TM5 and ETM+ [http://earthexplorer. usgs.gov/] (Figure 1), and 2,640 image scenes captured by the Chinese environmental satellite (HJ-1) [http://www.cresda.com/] (Figure 2). Images containing no (or few) clouds were preferentially selected, along with multi-spectral images of vegetation during the growing seasons. Images were also selected where possible to encompass a time period of one year either before, or after, 2010 (Table 4). However, in regions where it proved difficult to obtain images, this time phase was extended appropriately to ensure complete cloudless global
image coverage.
Table 4 Landsat image acquisition times
|
Year
|
2009
|
2010
|
2011
|
Other
|
|
Proportion
|
30.59%
|
41.06%
|
9.14%
|
19.21%
|
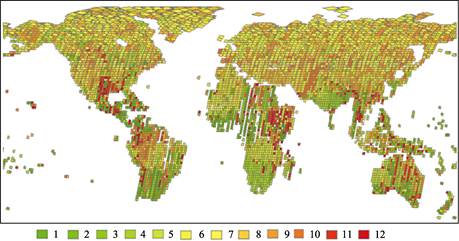
Figure 1 World map showing month-by-month (numbered 1 to 12) acquisition
of Landsat TM and ETM+ images
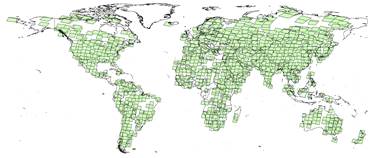
Figure 2 World map showing the data coverage area of the Chinese HJ-1 satellite
3.3 Data Preprocessing
Preprocessing was carried out to enable the application of data encompassing different time phases from the two distinct satellite series. This step is of considerable importance as the quality of the results from preprocessing results will directly affect the land surface water data products. Thus, our data preprocessing encompassed geometric correction and radiation calibration of satellite RS image data. The algorithms and processes used here follow those outlined in previous studies[12–17] for the management of 30 m resolution RS satellite data.
3.4 Remote Sensing Mapping and Data Product Development
Mapping land surface waters using satellite RS images and the development of a data pro-
duct (Figure 3) comprised automatic computer classification, human correction via computer interaction, and data integration[8,18].
3.4.1 Automatic Computer Classification
The computer-based classification process used in this study employed three algorithms to consider spectrum, scale, phase, and other differences between global water bodies to automatically extract land surface water area. This was done using a decision tree extraction method for water bodies based on prior knowledge[8,18–19], a maximum likelihood mask method based on the relationship between spectrums and the Tasseled Cap Wetness index (TCW)[20], and a supervised classification method that is based on Support Vector Machine and Maximum Likelihood Classifier (SVM/MLC).
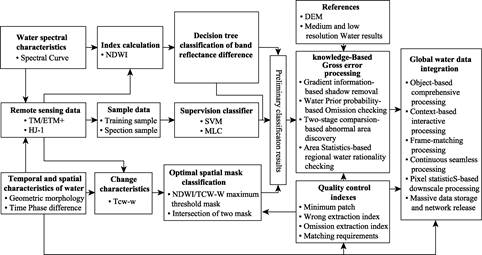
Figure 3 Diagram of the RS extraction method employed for global land surface water areas
3.4.2 Corrections via People-computer Interaction
In order to minimum the noises from the remote sensing images for the water identifying, we carried out correction using output of multi-scale segmentation as the basic editing unit, and performed comprehensive processing of finely-divided spot patterns on large-area water bodies. These finely-divided spot patterns were then filtered based on segmentation objects extracted from the results of auto-classification in accordance with the minimum established water body spot patterns. This people-computer editing process therefore minmized problems such as the presence of seasonal water bodies, confusion between types, distinctions between inland water and seas, and edge snap failures between scene-separated images.
3.4.3 Data Integration
We integrated data according to standards to enable the process of tiles composite. This process also enabled the generation of standardized geographic data products.
4 Dataset Composition
4.1 Dataset Spatial Distribution
The GlobeLand30-WTR2010 dataset presented in this paper covers all global land areas with the exception of Antarctica (Figure 4).
4.2 Data Framing
We framed data subsets according to latitude using the two approaches shown in Figure 5.
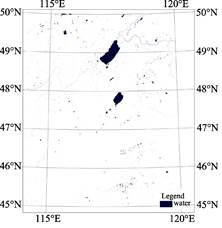
4.2.1 Data Framed by 5° Latitude × 6° Longitude
We framed data by 5° latitude × 6° longitude within the area encompassed by 60º of south-north latitude (Figure 6). This process led to the generation of 648 framed datasets.
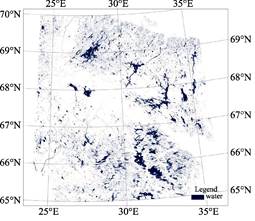
4.2.2 Data Framed by 5° Latitude × 12° Longitude
We framed data by 5° latitude × 12° longitude within the area encapsulated by between 60º and 80º south-north latitude. Within this area, data were framed and projected with respect to the central meridian of the odd number 6° zone (Figure 7), giving rise to 111 framed datasets.
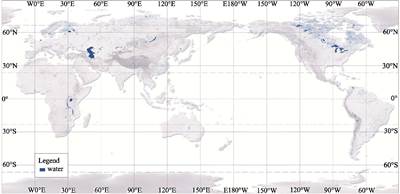
Figure 4 Map showing the spatial distribution of global areas of land surface water in 2010
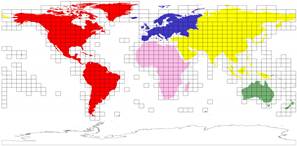
Figure 5 Map showing framing of the GlobeLand30-WTR2010 dataset
|
|
|
|
Figure 6 Map of water data from tile N50_45
|
Figure 7 Map of water data map from tile N35_65
|
In total, the GlobeLand30-Water2010 dataset contains 759 frames (excluding Antarctica). In each case, the trimming scope is the rectangular area formed by the minimum enclosing rectangle of the four corners of the frame expanding outward by 7,500 m (250 pixels). Area coverage is shown in figure 5, while all data documents and their corresponding geographic coordinates are presented in data document GlobeLand30_WTR2010.xlsx.
4.2.3 Data Document Name
The name of each framing data document is composed of 22 characters that are ordered in sequence comprising the abbreviation of south-north latitude (one bit), the 6° zone code (two bits), ‘_’, the initial latitude of the lower left hand corner (two bits), ‘_’, the product year (four bits), LC030 (the abbreviation for the 30 m solution land cover), and ‘_water’. Thus, for example, the data document name ‘N19_25_2010LC030_water’ refers to the 19th zone and includes 30 m resolution water area data for 2010 within the rectangular area encompassed by east longitudes between 108° and 114° and north latitudes between 25° and 30°. In terms of frames that span two 6° zones, the central meridian is filled with that of odd number 6° zone, while the code is the number of the odd number zone. Similarly, the initial latitude field is filled with the latitude value of the lower edge line of the frame in the northern hemisphere and the latitude value of the upper edge frame line in the southern hemisphere (GlobeLand30_WTR2010.xlsx).
4.3 Data Composition
4.3.1 Data Files
All GlobeLand30-2010 framing data are filed and can be downloaded and shared in the form of .rar file compressed packages, for example, N19_25_2010LC030_WTR.rar. Thus, the compressed data size of a single-frame data document is N19_25_2010LC030_WTR.doc. The total dataset size is 8 GB. Each compressed package contains four documents, including the classification results, coordinate information, a basic image map based on classified data, and metadata. Specifically, these comprise:
(1) The classification results document which records information on land coverage in the form of GeoTIFF raster data, encompassing 8-Bit 256 indexed color modes, and with an attribute value of 60;
(2) The coordinate information document which records classification results in TIFF WORD format;
(3) The basic image map based on a classified data document which records the scope of each major image frame as well as the vector acquisition time layers in shape file format;
(4) The Metadata document which records results of metadata classification, stored in XML format.
4.3.2 Appendix Files
All data files, corresponding coordinate collection data, and data bands are stored in files suffixed with ‘GlobeLand30_WTR2010.xlsx’ (Table 5).
5 Data Reliability
In order to verify the precision of the land surface water areas calculated during this project, we used a two-stage sampling model test for our spatial data. In the first stage, the test model was “frame sampling”, as each sampled unit was a frame, while in the second stage, the test model was ‘element sampling’, as each sampled unit was an element. Thus, 80 frames were sampled globally in order to evaluate precision (Figure 8, Figure 9), 6,438 sample points were selected at random. The results of this analysis show that the precision of sample mapping was 82.77%, while user precision was 92.09%.
Table 5 Examples of the composition, corresponding coordinates, and band numbers of data files
|
Serial no.
|
Map file name
|
Data file
collection
|
Data files
|
UTM band
number
|
Latitude range
|
Longitude range
|
|
1
|
N26_10
|
N26_10_2010LC030_WTR.rar
|
N26_10_2010LC030_WTR.tif,N26_10_2010LC030_WTR.tfw,N26_10_2010LC030_WTR.shp,N26_10_2010LC030_WTR.xml
|
26
|
N10° to N15°
|
W30° to W24°
|
|
2
|
N26_15
|
N26_15_2010LC030_WTR.rar
|
N26_15_2010LC030_WTR.tif, N26_15_2010LC030_WTR.tfw, N26_15_2010LC030_WTR.shp, N26_15_2010LC030_WTR.xml
|
26
|
N15° to N20°
|
W30° to W24°
|
|
...
|
...
|
...
|
...
|
...
|
...
|
...
|
|
759
|
S59_75
|
S59_75_2010LC030_WTR.rar
|
S59_75_2010LC030_WTR.tif, S59_75_2010LC030_WTR.tfw, S59_75_2010LC030_WTR.shp,
S59_75_2010LC030_WTR.xml
|
59
|
S75° to S80°
|
E168° to E180°
|
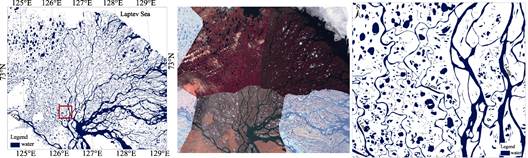
Figure 8 RS images and water area extraction results for the Lena River Estuary
6 Distribution Statistics for Global Land Surface Water Area
The total area of global land surface water in 2010 was 367.54×10⁴ km2, encompassing 2.73% of total land surface area [21]. At the same time, however, results also show that the spatial distribution of global land surface water is extremely uneven (Figure 10); observed along latitude, surface waters are mainly distributed in mid and high northern hemisphere latitudes and in equatorial regions of the southern hemisphere. Indeed, regions that globally encapsulate a higher percentage of surface water are mainly concentrated in the mid and high latitudes of the northern Hemisphere and in the tropics and high latitudes of the southern hemisphere. Observed along longitude, the areas of land surface water in the eastern and western hemispheres are approximately the same size and as evenly distributed as in the eastern hemisphere. In contrast, in the western hemisphere, surface waters are mainly concentrated in the zone between 60° WL and 140° WL. Breaking this down further on the basis of continents, results for land surface water area as a percentage of global surface water are as follows: North America, 152.89×10⁴ km2 (41.60%); Asia, 124.28×10⁴ km2 (33.81%); Europe, 31.59×10⁴ km2 (8.59%); Africa 27.19×10⁴ km2 (7.40%); South America, 26.78×10⁴ km2 (7.29%), and; Oceania, 4.82×10⁴ km2 (1.31%).
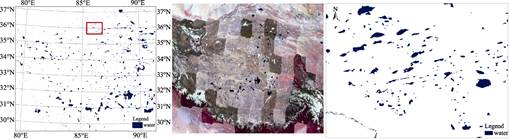
Figure 9 RS images and surface water extraction results for lakes on the Qinghai-Tibetan Plateau
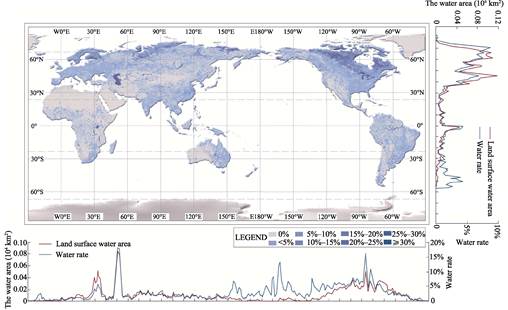
Figure 10 Map of the spatial distribution of global land surface water
7 Discussion
7.1 The Time Phase Problem in the Global Land Surface Water Dataset (2010)
There is a fundamental problems effect the data quality, because of the remote sensing
images from different months or years.
7.2 The Impact of Vertical Mountain Land Zonality on the Identification and Definition of Water Bodies
Under normal circumstances, our project team selected data from plant growth seasons as much as possible when filtering satellite RS images. In alpine regions, for example, the plant growth season refers specifically to the basal zone; thus, due to the vertical distribution of natural zones in mountainous areas, this zone in some regions of high elevation will still be within the growth season while it will be frozen at medium or higher elevations. This elevation difference has a large impact on the identification and definition of water bodies, as the shadow of mountain. To mitigate these issues, our project team employed MODIS data every eight days to make corrections via human-computer inspection and interaction.
8 Conclusion
The results of this project demonstrate that mapping using RS to continuously monitor the area of global land surface water is a meticulous but meaningful task. The dataset presented in this paper is the first installment of a global time sequence of 30 m resolution land surface water data products.
Acknowledgements
The Global Land Surface Water Dataset at 30 m Resolution (2010) is part of the outcomes based on the GlobeLand30 project, which was approved by the Ministry of Science and Technology of the P. R. China (MOST) in 2009, and received the full support of Xu, Guanhua, Xu, Deming and Ku, Rexi, leaders from MOST and the Chinese National Information Bureau of Geographic Surveying and Mapping.
Professor Townshed, John from University of Maryland, USA, provided 9,907 LANDSAT image scenes. The National Disaster Reduction Center of China provided 2,640 satellite data scenes, while the European Environment Agency (EEA), National Research Council of Canada (NRC), Geoscience Australia, and a number of other international institutions also provided reference data.
Director Liao, Xiaohan, Chief Engineer Li, Jiahong, Division Chief Zhang, Songmei and colleagues at the Chinese National Remote Sensing Center repeatedly organized expert meetings to discuss the research and development of this dataset. Liu, Jiyuan, Professor of Institute of Geographic Sciences and Natural Resources Research, Chinese Academy of Sciences, provided part of the land use reference data, while during the project execution period. The project was also supported by Li, Pengde, Deputy Director of the Chinese National Bureau of Geographic Information Surveying and Mapping, as well as of Li, Zhigang; Chen, Xianjun; Zhao, Yong; Jiang, Jie; Hu, Junhong; Song, Yonggang and their colleagues. This project was also supported by the international cooperation initiative of the Chinese National Bureau of Geographic Information Surveying and Mapping and the Chinese National Fundamental Geographic Information Center.
Thanks to the cooperation and promotion provided to this project by Dr. Rayin, Barbara the Executive Director of the Secretariat of the Intergovernmental Group on Earth Observations (GEO), the contents of this dataset were popularized, and applications and collaborations were realized both within the GEO framework and in the wider context of global validation. Indeed, the GEO established a working group to use RS to map global land surface cover (SB-02) in 2012; Professor Herold, Martin from Wageningen University & Research led this group and provided technical support that enabled the completion of this dataset. Similarly, the International Society for Photogrammetry and Remote Sensing (ISPRS) also established a working group to map global land surface cover using RS in August 2012; Professor Yifang Ban from the Swedish Royal Institute of Technology led this team and also provided technical support that enabled the completion of this dataset. The Committee on Data for Science and Technology (CODATA) Task Group of Preservation of and Open Access to S&T data in/for/with Developing Countries (PASTD) provided a great deal of assistance to enable the promotion, sharing, application, and validation of the GlobeLand30-WTR2010 dataset in developing countries; Professor Liu, Chuang of the Institute of Geographic Sciences and Natural Resources Researcher, Chinese Academy of Sciences (IGSNRR/CAS), Professor Zhou, Xiang of the Institute of Remote Sensing and Digital Earth, CAS led this team and provided case support for the promotion, application, and verification of this dataset. Similarly, Professor Liu, Chuang, Associate Professor Wang, Zhengxing, and Assistant Professor Shi, Ruixiang of the IGSNRR, CAS, Professor Ban, Yifang and Professor Manakos, Ioannis of the Greek Institute of Information and Technology, Greece, Professor Brocelli, Maria A. of the Polytechnic University of Milan, Italy, and Research Fellow See, Linda of IIASA all performed quality inspection and verification on parts of the GlobeLand30-WTR2010 dataset and provided validation reports. Professor Liu, Jiyuan and Zhou, Qiming from Hong Kong Baptist University made valuable suggestions for dataset revisions, while Professor Tang, Ping’s team from the Institute of Remote Sen-
sing and Digital Earth, CAS, Professor Chen, Jin’s team from Beijing Normal University, Professor Gong, Peng’s team from Tsinghua University, and Professor Tong, Xiaohua’s team from Tongji University all participated in project discussions.
The GlobeLand30 project team held an ISPRS/GEO joint international seminar on dataset issues in Beijing between April 27th, 2013, and April 28th, 2013. This seminar was jointly organized by Professor Mora, Brice (GOFC-GOLD Land Surface Covering Project Office), Sarantakos, Georgios (GEO Secretariat), Langanke, Tobias (EEA), Uhlir, Paul F. (Chairman of the National Science Research Information and Data Committee, USA), and Liu, Chuang. We thank all these attendees for their discussion of relevant data issues concerning science, technology, and results, and for their suggestions for improvements.
In May 2014, Academician Xu, Guanhua and Director Xu, Deming presented preliminary opinions on the development of an open access policy for the GlobeLand30 data. In August 2014, this dataset was offered as open access and a public-welfare shared data policy was approved by the Chinese government. In the same month, the National Remote Sensing Center of the Chinese Ministry of Science and Technology organized a team of experts, led by Academician Guo, Huadong, to initiate the review and acceptance of these data.
In December 2013, Mr. Wu, Hongbo, the Under Secretary-general of the United Nations, visited the Chinese National Bureau of Geographic Information Surveying and Mapping and agreed to offer the GlobeLand30-2010 dataset to the UN. In April 2014, Wu visited the Chinese National Bureau of Geographic Information Surveying and Mapping once more to make preliminary arrangements for the presentation of these data to the UN by China. On September 22nd, 2014, at the Climate Summit held in UN headquarters, New York, Zhang, Gaoli, representative of the State President and Vice Premier of the State Council, presented the GlobeLand30-2010 dataset to the UN Secretary-general, Mr. Ki-moon, Ban, the Secretary general expressed his thanks for this generous donation, noting that it was very timely, and remarking that this ‘detailed dataset would help us better understand, monitor, and manage the changes in global land surface and land use.
References
[1] Foley, J. A., Gregory, R. D., Barford, C., et al. Global consequences of land use [J]. Science, 2005, 309: 570. DOI: 10.1126/science.1111772.
[2] Oki, T., Kanae, S. Global hydrological cycles and world water resources [J]. Science, 2006, 313: 1068. DOI: 10.1126/science.1128845.
[3] Vörösmarty, C. J., Green, P., Salisbury, J., et al. Global water resources: vulnerability from climate change and population growth [J]. Science, 2000, 289: 284-288.
[4] Prigent, C., Papa, F., Aires, F., et al. Changes in land surface water dynamics since the 1990s and relation to population pressure [J]. Geophysical Research Letters, 2012, 39: L08403. DOI: 10.1029/2012GL051276.
[5] Chen, J., Chen J., Gong, P., et al. High resolution global land cover mapping [J]. Geomatics World, 2011, 9(2): 12-14.
[6] Chen, J., Chen J., Liao, A. P., et al. Concepts and key techniques for 30 m global land cover mapping [J]. Acta Geodaetica & Cartographica Sinica, 2014, 43(6): 551-557. DOI: 10. 13485/j.cnki.11G2089.2014.0089.
[7] Chen, J., Liao, A. P., Chen, L. J., et al. The content and composition of global dataset of land surface water at 30m resolution (2010) [DB/OL]. Global Change Research Data Publishing and Repository, 2014. DOI: 10.3974/geodb.2014.02.01.V1.
[8] Liao, A. P, Chen, L. J., Chen, J., et al. High-resolution remote sensing mapping of global land water [J]. Science China: Earth Sciences, 2014, 57: 1-6.
[9] The national basic scale map compilation specification: the 1st part: 1??25 000 1??50 000 1??100 000 scale topographic map compilation specification: GB/T 12343.1-2008 [S]. Beijing: Chinese Standards Press, 2008.
[10] The national basic scale map compilation specification: the 2nd part: 1??250 000 scale topographic map compilation specification: GB/T 12343.2-2008 [S]. Beijing: Chinese Standards Press, 2008.
[11] Chen, C. X., Hu, C. M., Huo, L. Z., Tang, P. Effect of different radiation correction methods of Landsat TM data on land-cover remote sensing classification [J]. Journal of Remote Sensing, 2014, 18(2): 320-334.
[12] Hu, C. M., Zhang, W., Feng, Z., Tang, P. Landsat TM/ETM+ and HJ-1A/B CCD data automatic relative radiation normalization and accuracy verification [J]. Journal of Remote Sensing, 2014, 18(2): 267-286.
[13] Jiang, K., Hu, C. M., Yu, K., et al. Landsat TM/ETM+ topographic correction method based on smoothed terrain and semi-empirical model [J]. Journal of Remote Sensing, 2014, 18(2): 287-306.
[14] Li, D. C., Tang, P., Hu, C. M., et al. Spatial-temporal fusion algorithm based on an extended semi-physical model and its preliminary application [J]. Journal of Remote Sensing, 2014, 18(2): 307-319.
[15] Shan, X. J., Tang, P., Hu, C. M., et al. Automatic geometric precise correction technology and system based on hierarchical image matching for HJ-1A/B CCD images [J]. Journal of Remote Sensing, 2014, 18(2): 254-266.
[16] Tang, P., Zhang, H. W., Zhao, Y. C. et al. Practice and thoughts of the automatic processing of multispectral images with 30 m spatial resolution on the global scale [J]. Journal of Remote Sensing, 2014, 18(2): 231-253.
[17] GCdataPR Editorial Office. GCdataPR data sharing policy [OL]. DOI: 10.3974/dp.policy.2014.05 (Updated 2017).
[18] Chen, L. J., Chen, J., Liao, A. P. Preliminary classification results for global land cover mapping at 30 meters resolution. Bulletin of Surveying and Mapping, 2012 (sup): 350-353.
[19] Chen, J., Chen, J., Liao, A. P., et al. Global land cover mapping at 30 m resolution: A POK-based operational approach [J]. ISPRS J. Photogram Remote Sensing, 2014, 103:7-27.
[20] Wu, W. Y., Shen, X. H., Zhou, L. J., et al. An integrated method for water body detection and delineation using Landsat ETM+ data [J]. Bulletin of Science and Technology, 2008, 24(2): 252-259.
[21] Cao, X., Chen, J., Chen, L. J., et al. Preliminary analysis of spatiotemporal pattern of global land surface water [J]. Science China: Earth Sciences, 2014, 44: 1661-1670.