Urban Development Level Dataset Based on Nighttime Light Images for Taihu Lake basin
Gu, Y. Y.1 Qiao, X. N.2* Lin, N. F.1 Xu, M. J.1 Huang, X. F.3
1. Nanjing Institute of Environmental Sciences, Ministry of Ecology and Environment, Nanjing 210042, China;
2. School of Surveying and Land Information Engineering, Henan Polytechnic University, Jiaozuo 454003, China;
3. Guizhou Institute of Environmental Sciences Research and Design, Guiyang 550081, China
Abstract: Using stable nighttime light images from the Operational Line Scan System of the Defense Meteorological Satellite Program and combined with socio-economic development data, we proposed and verified an urban development level (UDL) index based on the concept of land use degree and created a UDL dataset for Taihu Lake basin from 2000 to 2010. The results show that the UDL based on nighttime light data can reflect the characteristics of urban development (e.g., economic development, urban boundary expansion, and proportion of non-agricultural population) and characterize urban expansion effectively. From 2000 to 2010, the UDL in Taihu Lake basin primarily increased around the downtown areas of cities. The northern, eastern, and southeastern parts of the basin contain flat terrain and convenient access, leading to dramatic human activities and rapid urban development. The natural features of the southwestern and western parts of the basin (e.g., topography) led to a slow increase of UDL in these regions. The analysis paper based on the UDL dataset for Taihu Lake basin was published in Acta Ecologica Sinica (Vol. 38, No. 16, 2018).
Keywords: nighttime light images; urban expansion; urban development level; Taihu Lake basin; Acta Ecologica Sinica
1 Introduction
Urban development is a complex process involving many factors, including social economy, population, and geographical space. Urban development level (UDL) can reflect the phenomenon of urban expansion effectively[1]. UDL is of great significance to regional sustainable management as it can be used to strengthen the monitoring of urban expansion. The nighttime light images obtained by the Operational Line Scan System (OLS) of the Defense Meteorological Satellite Program (DMSP) can detect effectively the low-intensity light signals generated by urban nighttime lighting and even small-scale residential lighting and light from traffic. The DMSP/OLS images are good source data for monitoring human activities and studying urban development[2–3]. DMSP/OLS nighttime images have been widely used to investigate urban development[4], the spatial distribution of GDP[5–6], energy consumption and carbon emissions[3], and ecological and environmental impacts[7]. Some researchers have indirectly analyzed changes in human activities based on changes in the normalized difference vegetation index[8], land use/land cover[9], potential net primary production[10–11], and other indicators. However, few studies have quantified UDL to characterize human activity based on nighttime light images[7]. Furthermore, existing studies are rarely conducted on the county or smaller scale. Herein, we combined DMSP/OLS stable nighttime light images with socio-economic development data to create a UDL dataset based on the concept of land use degree. This dataset can support the development of differentiated urban development policies.
2 Metadata of Dataset
The metadata of the “Dataset of urban development level in the Taihu Lake basin (TLB) based on nighttime light images (2000–2010)”[12] is summarized in Table 1. It included the dataset full name, short name, authors, year of the dataset, temporal resolution, spatial resolution, data format, data size, data files, data publisher, and data sharing policy, etc.
Table 1 Metadata summary of “Dataset of urban development level in the Taihu Lake basin based on nighttime light images (2000–2010)”
|
Items
|
Description
|
|
Dataset full name
|
Dataset of urban development level in the Taihu Lake basin based on nighttime light images (2000–2010)
|
|
Dataset short name
|
UDL_TaihuLakeBasin_2000-2010
|
|
Authors
|
Qiao, X. N. A-2330-2019, School of Surveying and Land Information Engineering, Henan Polytechnic University, qiaoxuning@126.com
|
|
Gu, Y. Y. T-2889-2018, Nanjing Institute of Environmental Sciences, Ministry of Ecology and Environment, gyy@nies.org
Zou, C. X. A-2951-2019, Nanjing Institute of Environmental Sciences, Ministry of Ecology and Environment, zcx@nies.org
Huang, X. F. A-2542-2019, Guizhou Institute of Environmental Sciences Research and Design, bloodworlf@qq.com
Hu, T. A-2471-2019, Chinese Research Academy of Environmental Sciences, hpuht001@ 163.com
|
|
Geographical region
|
Taihu Lake basin, 3.69Í104 km2, 30°28′N–32°15′N, 119°11′E–121°51′E
|
|
Year
|
2000–2010
|
|
Temporal resolution
|
1 year Spatial resolution 1 km
|
|
Data format
|
.tif
|
Data size 313 KB (after compression)
|
|
Data files
|
The dataset consists of 11 data files (2000, 2001, 2002, 2003, 2004, 2005, 2006, 2007, 2008, 2009 and 2010)
|
|
Foundations
|
Ministry of Science and Technology of P. R. China (2017YFC0506606, 2016YFC0502106); National Social Science Foundation of China (14BJY021); Henan Projects for Colleges and Universities (2018-YXXZ-07, 2014GGJS-044, 2016-CXTD-04)
|
|
Data publisher
|
Global Change Research Data Publishing & Repository, http://www.geodoi.ac.cn
|
|
Address
|
No. 11A, Datun Road, Chaoyang District, Beijing 100101, China
|
|
Data sharing policy
|
Data from the Global Change Research Data Publishing & Repository includes metadata, datasets (data products), and publications (in this case, in the Journal of Global Change Data & Discovery). Data sharing policy includes: (1) Data are openly available and can be free downloaded via the Internet; (2) End users are encouraged to use Data subject to citation; (3) Users, who are by definition also value-added service providers, are welcome to redistribute Data subject to written permission from the GCdataPR Editorial Office and the issuance of a Data redistribution license; and (4) If Data are used to compile new datasets, the ‘ten per cent principal’ should be followed such that Data records utilized should not surpass 10% of the new dataset contents, while sources should be clearly noted in suitable places in the new dataset[13]
|
3 Methods
3.1 Data Sources and Preprocessing
Nighttime light images were acquired from the National Geographysical Data Center (NGDC) (http://ngdc.noaa.gov/eog/dmsp). The stable light data primarily cover areas near cities, towns, and other regions with permanent light sources. The spatial resolution of the data is 30 arc-seconds. The grey value of the data ranges from 0 to 63[14]. For the stable nighttime light data, saturated pixels were found near town centers. Therefore, global unsaturated nighttime light data in 2006 were used to correct the radiation of the stable nighttime light data. Using ENVI 5.3 software, 11 global nighttime light images from 2000 to 2010 were reprojected into Lambert’s isometric conical projections. These images were then resampled to a 1-km resolution grid, and TLB vector boundaries were used for masking.
|
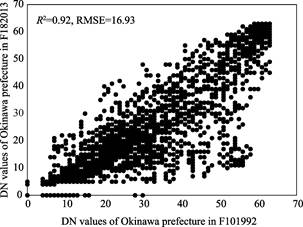
Figure 1 Comparison of simulated digital number values in 1992 (F101992) and 2013 (F182013) for Okinawa prefecture, Japan
Note: DN is the digital number.
|
Referring to the correction method of Wu et al.[15] and Cao et al.[16], we selected Okinawa prefecture, Japan as the constant target for image radiation correction for the following reasons: (1) Okinawa prefecture has experienced relatively few social and economic changes in the past 20 years, and its development process is relatively stable; (2) the digital number (DN) in the images of Okinawa prefecture are evenly distributed from low to high; and (3) the nighttime light images of Okinawa prefecture in 1992 showed a good linear relationship with the nighttime light images in 2013 (R2=0.92, RMSE=16.93; Figure 1). According to previous studies[15,17], the power function correction model has the best correlation for these data; thus, this model was chosen to establish the correction model, as in Eq. (1):
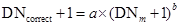 (1)
(1)
where DNm and DNcorrect represent the pixel DN values before and after correction, respectively, and a and b are power function regression parameters.
3.2 Algorithm Principle
Based on the concept of land use degree[9], we characterized urban expansion by developing a UDL index[18], which can be described as follows:
 (2)
(2)
 (3)
(3)
where U is the UDL in the study area; Di is value of the i-th night light pixel (range of pre-corrected values = 0–63); Pi is value of the i-th night light pixel area percentage; ΔUb-a is the change in UDL; Ua and Ub represent the percentages of UDL corresponding to the i-th grade for time a and time b, respectively. If ΔUb-a is positive, the UDL at time b is greater than that at time a; otherwise, the opposite is true.
4 Results and Validation
4.1 Data Composition
The composition of the “Dataset of urban development level in the Taihu Lake basin based on nighttime light images (2000–2010)” is shown in Table 2.
Table 2 Composition of the UDL dataset for Taihu Lake basin
|
Data name
|
Data time period
|
Spatial resolution
|
|
Dataset of urban development level in the Taihu Lake basin based on nighttime light images (2000–2010)
|
2000, 2001, 2002, 2003, 2004, 2005, 2006, 2007, 2008, 2009, 2010
|
1 km
|
4.2 Data Products
The spatial distribution of UDL in TLB from 2000 to 2010 is shown in Figure 2. In 2000, the areas of high UDL were mainly distributed in the urban areas of Shanghai Municipality, Suzhou city, Wuxi city, and Changzhou city. In contrast, the UDLs of Yixing city, Fuyang
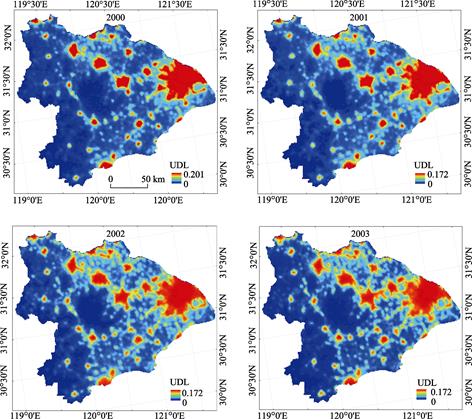
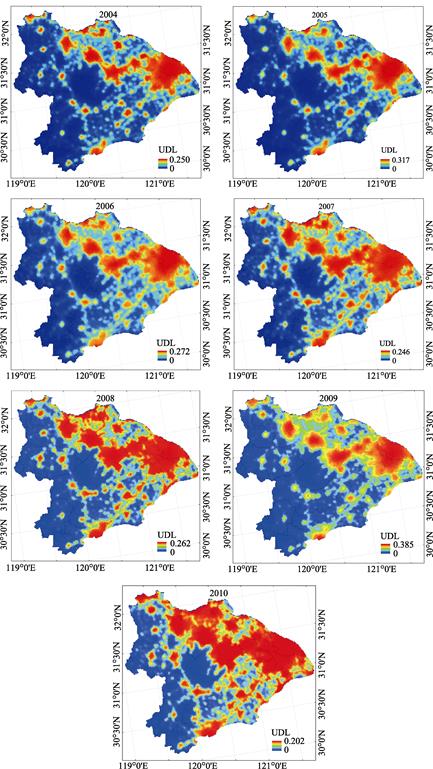
Figure 2 Spatial distribution of urban development level (UDL) in Taihu Lake basin from 2000 to 2010
city were low. These urban areas began to develop during the study period, resulting in the agglomeration of high-UDL areas in 2010. In 2000, areas with low UDL were widely distributed, and the level of human activities in TLB was relatively low. In 2010, the high-UDL areas were found in the eastern, northern, and southeastern parts of the basin. In the southwestern and western parts of TLB (e.g., Anji county and Changxing county), urban development was relatively slow. From 2000 to 2010, the UDL in TLB primarily spread around the downtown areas of cities. Due to the flat terrain and convenient access in the northern, eastern, and southeastern parts of the basin, human activities were intense, and UDL increased rapidly during the study period. In contrast, in the southwestern and western parts of the basin, urban development was limited by natural factors such as topography.
4.3 Data Validation
The relationship between GDP, built-up area, non-agricultural population, and non-agricultural population ratio (non-agricultural population/total population) and the total UDL (UDLsum) from 2000 to 2010 is shown in Figure 3. All four factors and the UDLsum increased with time during the study period, and the regression of the four factors as a function of UDLsum were significant, with R>0.9, R2>0.83, and P<0.01 for the F-test. Therefore, the UDL index based on nighttime light data can comprehensively reflect the characteristics of urban development.
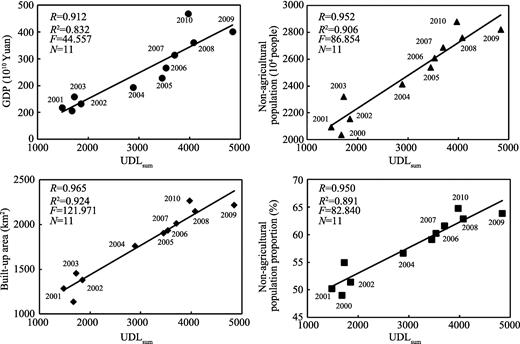
Figure 3 Relationships between UDLsum and GDP, built-up area, non-agricultural population, and non-agricultural population ratio in TLB from 2000 to 2010
5 Discussion and Conclusion
The UDL calculated based on nighttime light data for TLB is strongly correlated with GDP, built-up area, non-agricultural population, and the non-agricultural population ratio. Thus, UDL can effectively characterize urban expansion. From 2000 to 2010, UDL increased rapidly in the northern, eastern, and southeastern parts of TLB, whereas UDL increased slowly in the southwestern and western regions. The nighttime light data were corrected using the invariant region method, effectively solving the problem of pixel saturation and allowing UDL to be compared between different years. In a future study, we plan to optimize this correction process by incorporating the continuity correction method.
Author Contributions
Qiao, X. N. designed the dataset; Huang, X. F. collected and processed the data; Xu, M. J. designed the model and algorithm; Lin, N. F. verified the model; and Gu, Y. Y. wrote the data paper.
References
[1] Chen, J., Zhuo, L., Shi, P. J., et al. The study of urbanization process in China based on DMSP/OLS data: development of a light index for urbanization level estimation [J]. Journal of Remote Sensing, 2003, 7(3): 168–175.
[2] Elvidge, C. D., Cinzano, P., Pettit, D. R. The Nightsat mission concept [J]. International Journal of Remote Sensing, 2007, 28(12): 2645–2670.
[3] Gu, Y. Y., Qiao, X. N., Fan, L. X., et al. Spatial analysis of carbon emissions from region energy consumption based on night light data [J]. Science of Surveying and Mapping, 2017, 42(2): 140–146.
[4] Gao, Y. H., Gu, Y. Y., Qiao, X. N., et al. Study on extracting urban area in Nanjing based on DMSP/OLS nighttime light data [J]. Science of Surveying and Mapping, 2017, 42(6): 93–98, 154.
[5] Shi, K. F., Huang, C., Yu, B. L., et al. Evaluation of NPP-VIIRS night-time light composite data for extracting built-up urban areas [J]. Remote Sensing Letters, 2014, 5(4): 358–366.
[6] Jean, N., Burke, M., Xie, M., et al. Combining satellite imagery and machine learning to predict poverty [J]. Science, 2016, 353(6301): 790.
[7] Liu, Y. X., Wu, W. H., Wen, X. J., et al. Urban process and its eco-environmental impact in Shanxi-Shaanxi-Inner Mongolia energy area [J]. Geographical research, 2013, 32(11): 2009–2020.
[8] Xin, Z. B., Xu, T. X., Zheng, W. Impacts of climate change and human activities on vegetation cover change in the Loess Plateau [J]. Science in China (D: Earth Science), 2007, 37(11): 1504–1514.
[9] Wu, L. N., Yang, S. T., Liu, X, Y., et al. Response analysis of land use change to the degree of human activities in Beiluo River basin since 1976 [J]. Acta Geographica Sinica, 2014, 69(1): 54–63.
[10] Pan, G. X., Shen, T., Ma, X. D., et al. Effects of human activites and natural factors on ecological environment of the Hailiutu river basin [J]. Journal of Arid land Resources and Environment, 2017, 31(4): 67–72.
[11] Mao, D. H. Quantitative assessment in the impacts of human activities on net primary productivity of wetlands in the Northeast China [D]. Changchun: University of Chinese Academy of Sciences (Northeast Institute of Geography and Agroecology), 2014.
[12] Qiao, X. N., Gu, Y. Y., Zou, C. X., et al. Dataset of urban development level in the Taihu Lake basin based on nighttime light images (2000–2010) [DB/OL]. Global Change Research Data Publishing & Repository, 2018. DOI: 10.3974/geodb.2018.08.16.V1.
[13] GCdataPR Editorial Office. GCdataPR data sharing policy [OL]. DOI: 10.3974/dp.policy.2014.05 (Updated 2017).
[14] Huang, Q. X., He, C. Y., Gao, B., et al. Detecting the 20 year city-size dynamics in China with a rank clock approach and DMSP/OLS nighttime data [J]. Landscape and Urban Planning, 2015, 137: 138–148.
[15] Wu, J. S., He, S. B., Peng, J., et al. Intercalibration of DMSP-OLS night-time light data by the invariant region method [J]. International Journal of Remote Sensing, 2013, 34(20): 7356–7368.
[16] Cao, Z. Y., Wu, Z. F., Kuang, Y. Q., et al. Correction of DMSP/OLS Night-time light images and its application in China [J]. Journal of Geo-information Scince, 2015, 17(9): 1092–1102.
[17] Elvidge, C. D., Ziskin, D., Baugh, K. E., et al. A Fifteen year record of global natural gas flaring derived from satellite data [J]. Energies, 2009, 2(3): 595–622.
[18] Qiao, X. N., Gu, Y. Y., Zou, C. X., et al. The impact of urban expansion on net primary productivity in the Taihu Lake basin based on nighttime light images [J]. Acta Ecologica Sinica, 2018, 38(16): 5883–5893.