Simulation Dataset on Planet Juncture Index and Heliocentric Longitude of Planetary System Barycentre
Sun, W.1,3,4 Wang, J.2,3* Liu, F. Y.1* Wang, Y.1 Chen, J. R.2,3
1. School of Mathematics, Physics & Statistics, Shanghai University of Engineering Science, Shanghai 201620, China;
2. Jiangsu Second Normal University, Nanjing 210013, China;
3. School of Geography/School of Mathematics, Nanjing Normal University, Nanjing 210023, China;
4. School of Resources and Environment, Anqing Normal University, Anqing 246133, China
Abstract: Planet juncture index and heliocentric longitude of planetary system barycentre are key parameters for showing the motion features of a planetary system. This research sorts out and analyzes the following factors: (1) planet juncture index and planetary system heliocentric longitude datasets from 1000 A. D. to 2000 A. D., (2) planetary system barycentre around the sun and the sun around the solar system barycentre from 1900 A. D. to 2000 A. D., and (3) positions between the sun ontology and the solar system barycentre from 1000 A. D. to 2000 A. D. The datasets reveal that the relation between planet juncture index and heliocentric longitude are complicated, with remarkable periodicity parameters of 19.85 and 180 years for the former and 11.5 and 180 years for the latter. The motions of the planetary system around the sun and the sun around the solar system barycentre are approximately 11.5 years periodic. Our analysis of the data of the positions between the sun and the solar system barycentre for 1000 years indicates that the probability of the solar system barycentre being in the body of the sun during the track is 34.5%. The dataset has four tables. Table 1 records the data on the planet juncture index and planetary system’s heliocentric longitude from 1000 A. D. to 2000 A. D. Table 2 records the data on the planetary system barycentre around the sun from 1900 A. D. to 2000 A. D. Table 3 records the data on the sun around the solar system barycentre from 1900 A. D. to 2000 A. D., and Table 4 records the data on the positions between the sun ontology and the solar system barycentre from 1000 A. D. to 2000 A. D. The dataset is archived in .xlsx format in one file with data size of 172 KB.
Keywords: planet juncture index; heliocentric longitude of planetary system; sun ontology;periodicity
1 Introduction
Milankovitch theory[1] is an astronomical theory used to study the relationship between solar radiation and earth’s climate at the global level. Milankovitch theory holds that the summer in the northern high-latitude region has an important effect on the changes in solar radiation by three orbital elements of the Earth. These elements are declination, precession and eccentricity, which is one of the main forces driving the quaternary glacial cycle and one astronomical factor driving global climate change in a single sensitive region[2–3]. Global climate change caused by the orbit cycle has become a research hotspot. The driving of planetary motion may be inexorable with the rise of the new theory of global climate change[4–6]. Thus, new avenues of discovery in global climate change research by planetary motion have been opened.
The planetary system’s juncture index and heliocentric longitude are two important kinematic indexes of the movement of the planetary system. The planet juncture index and heliocentric longitude are used to investigate the periodic planetary system movement and the astronomical factor driving global climate change[7]. The planet juncture index represents the degree of convergence and separation of the planetary system and the distance between the barycentre of the planetary system and the sun[8]. The heliocentric longitude of the planetary system represents the exact location of the barycentre of the planetary system relative to that of the solar system[9]. Kinematic indexes show a complex periodic characteristic along with planet motion. Meanwhile, solar activity and global climate change have the same periodic trends. Results of this study bear significance and value regarding solar activity and global climate change. Datasets contain the following aspects: 1) data of the planet juncture index and heliocentric longitude of the planetary system for one thousand years; 2) planetary system barycentre around the sun and the sun around the solar system barycentre for 100 years; and 3) data of the positions between sun ontology and the solar system barycentre for 1,000 years. This dataset is useful for researching the pattern and characteristic of solar activity and global climate change.
2 Metadata of Dataset
The metadata of dataset of planet juncture index and the planetary system heliocentric longitude[10] are summarized in Table 1.
3 Methods
3.1 Data Source
The astronomical data of the planets was from NASA. The website NASA.gov provides news, images and videos from the American space agency, which conducts space exploration, scientific discovery and aeronautics research. Table 2 shows the astronomical data of planets.
3.2 Data Processing
Planet juncture index and the planetary system’s heliocentric longitude are two important kinematic indexes of the planetary system. Both factors are used to investigate the periodic planetary system movement and the astronomical factor driving global climate change. Liu and Wang[8] defined planet juncture index as the norm of the total quality-vector weights for the planetary system. The spatial expression of the planet juncture index (K) can then be obtained where K is the planet juncture index (-), ri is the total radius-weights-vector (km), φi is the heliocentric longitude (°), ωi is the angular velocity (rad/a) and t is the time (a).
Table 1 Metadata summary of dataset of planet juncture index and planetary system heliocentric longitude
|
Items
|
Description
|
|
Dataset full name
|
Dataset of planet juncture index and planetary system heliocentric longitude
|
|
Dataset short name
|
PlanetJunctureIndexPlanetarySystemHeliocentricLongitude
|
|
Authors
|
Sun, W. I-4578-2016, School of Mathematics, Physics & Statistics, Shanghai University of Engineering Science, sunweiay@163.com
Liu, F. Y. S-7189-2018, School of Mathematics, Physics & Statistics, Shanghai University of Engineering Science, liufuyao2017@163.com
Wang, J. S-8853-2018, Jiangsu Second Normal University; School of Geography, Nanjing Normal University, jwang169@ vip.sina.com
Wang, Y. S-7237-2018, School of Mathematics, Physics & Statistics, Shanghai University of Engineering Science, wangying424524@163.com
Chen, J. R., Jiangsu Second Normal University, School of Mathematics, Nanjing Normal University, jrchen@njnu.edu.cn
|
|
Geographical region
|
The solar system Year 1000 A. D.-2000 A. D.
|
|
Data format
|
.xlsx Data size 172 KB
|
|
Data files
|
Four tables in one Excel file: 1) data of the planet juncture index and the planetary system heliocentric longitude; 2) planetary system barycentre around the sun; 3) sun around the solar system barycenter; and 4) position between sun ontology and the solar system barycentre
|
|
Foundation(s)
|
National Natural Science Foundation of China (41807437, 11803020, 11533004); Natural Science Foundation of Anhui Province (1808085QD99, KJ2017A371, AQKJ2015B021); Jiangsu Province (164320H116)
|
|
Data publisher
|
Global Change Research Data Publishing & Repository, http://www.geodoi.ac.cn
|
|
Address
|
No. 11A, Datun Road, Chaoyang District, Beijing 100101, China
|
|
Data sharing policy
|
Data from the Global Change Research Data Publishing & Repository include metadata, datasets (data products) and publications (in this case, the Journal of Global Change Data & Discovery). Data sharing policies are the following. (1) Data are openly available and can be downloaded for free via the Internet. (2) End users are encouraged to use Data subject in citations. (3) Users, who are value-added service providers by definition, are welcome to redistribute the Data subject with written permission from the GCdataPR Editorial Office and the issuance of a Data redistribution license. (4) If Data are used to compile new datasets, then the ‘ten per cent principal’ should be followed such that Data records utilised should not surpass 10% of the new dataset contents, while sources should be clearly noted in suitable places in the new dataset[11]
|
Table 2 Astronomical data about the planetary orbits (January 2000)
|
Name
|
Period
(d)
|
Heliocentric longitude (°)
|
Average orbit
radius (km)
|
Astronomical unit
(1 AU)
|
Radius weights (km)
|
Angular velocity (rad/a)
|
|
Mercury
|
87.969
|
252.250,84
|
56,672,443.84
|
0.387,098,93
|
4.690,91 E-05
|
26.088,407,62
|
|
Venus
|
224.701
|
181.979,73
|
108,207,517.8
|
0.723,331,99
|
0.001,320,004
|
10.213,444,22
|
|
Earth
|
365.256
|
100.464,35
|
149,579,112
|
1.000,000,11
|
0.002,238,882
|
6.283,185,3
|
|
Mars
|
686.98
|
355.453,32
|
226,923,421.8
|
1.523,662,31
|
0.000,363,432
|
3.340,666,584
|
|
Jupiter
|
4,332.587
|
34.404,038
|
777,657,818.7
|
5.203,363,01
|
3.699,505,551
|
0.990,699,953
|
|
Saturn
|
10,759.22
|
49.944,32
|
1,431,426,696
|
9.537,070,32
|
2.038,821,640
|
0.213,302,742
|
|
Neptune
|
30,685.4
|
313.232,18
|
2,869,262,907
|
19.191,239,3
|
0.624,274,378
|
0.074,790,328
|
|
Pluto
|
60,189.0
|
304.880,3
|
4,494,894,315
|
30.481,686,77
|
1.153,633,570
|
0.038,129,411
|
Note: These are basic data from the National Aeronautics and Space Administration (NASA).
 (1)
(1)
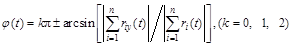
The planetary system heliocentric longitude was first defined by Sun et al.[12] and Sun[13] as the angle between the line from the projection of the planetary system’s barycentre to the datum to the sun’s barycentre and datum axis. The planetary system heliocentric longitude is denoted as φ and expressed as follows:
 (2)
(2)
where φ is the planetary system heliocentric longitude (0≤φ<2π), k is a constant, riy is the component vector on the y axis, ri is the sum vector and t is the year. The dates in Table 2 and planet motion are considered in this study. Accordingly, the different years of the planet juncture index and the planetary system heliocentric longitude can be obtained for studying the periodic trends by numerical simulation using Equations (1) and (2).
4 Results and Validation
4.1 Data Composition
Datasets of the planet juncture index and the planetary system heliocentric longitude contain the following aspects[10]:
(1) Data of the planet juncture index and the planetary system heliocentric longitude from 1000 A. D. to 2000 A. D. (archived in .xlsx format, as shown in Figure 1);
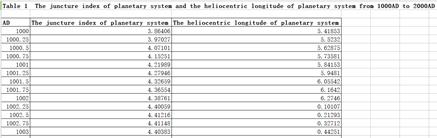
Figure 1 An excerpt from the table of the planet juncture index and the planetary system heliocentric longitude from 1000 A. D. to 2000 A. D.
(2) Data of the planetary system barycentre around the sun from 1900 A. D. to 2000 A. D. (archived in .xlsx format, as shown in Figure 2);
(3) Data of the sun around the solar system barycentre from 1900 A. D. to 2000 A. D. (archived in .xlsx format, as shown in Figure 3);
(4) Data of the positions between the sun ontology and the solar system barycentre from 1000 A. D. to 2000 A. D. (archived in .xlsx format, as shown in Figure 4).
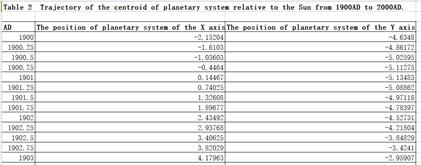
Figure 2 An excerpt from the table of the planetary system barycentre around the sun
from 1900 A. D. to 2000 A. D.
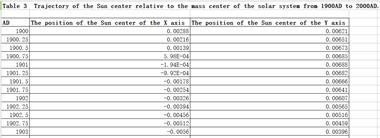
Figure 3 An excerpt from the table of the sun around the solar system barycentre from 1900 A. D. to 2000 A. D.
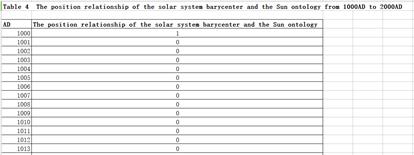
Figure 4 An excerpt from the table of the positions between the sun ontology and the solar system
barycentre from 1000 A. D. to 2000 A. D.
|
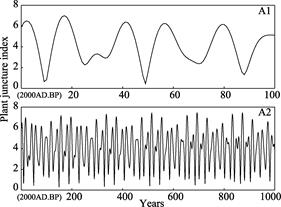
Figure 5 Chart of planet juncture index
|
4.2 Data Products
4.2.1 Planet Juncture Index
The planet juncture index represents the degree of convergence and separation of the planetary system. In theory, the maximum value of the planet juncture index is 7.520,204 when the planets lie on the same side of the sun. The value of the planet juncture index is usually less than the maximum value because the planet heliocentric longitudes are rarely uniform. Figure 5 shows the planet juncture index changing chart. Figure 5(A1) shows that the planet juncture index lasts 100 years from 1900 A. D. to 2000 A. D. Among the significant trends, the cycle of the maximum or minimum value of planet juncture index is approximately 19.85 years. Figure 5(A2) shows that the planet juncture index lasts 1,000 years from 1000 A. D. to 2000 A. D. Among the significant trends, the cycle of the maximum or minimum value of planet juncture index is about 180 years. These periodicities are consistent with the change in solar activity and global climate change.
4.2.2 Planetary System Heliocentric Longitude
The planetary system heliocentric longitude represents the exact location of the barycentre of the planetary system relative to that of the solar system. The heliocentric longitude is in radians. The acceptable values for the planetary system heliocentric longitude range from 0 to 2π. Figure 6 shows the planetary system heliocentric longitude changing chart. The graph’s horizontal
|

Figure 6 Chart of planetary system heliocentric longitude
|
axis shows the time range, and the vertical axis shows the planetary system heliocentric longitude. Figure 6(B1) shows that the planetary system heliocentric longitude lasts 100 years from 1900 A. D. to 2000 A. D. Among the significant trends, the planetary heliocentric longitude has a period of 11.5 years, indicating that the planetary system barycentre takes 11.5 years to move around the sun. Figure 6(B2) shows that the planetary system heliocentric longitude over time from 1000 A. D. to 2000 A. D. The planetary system heliocentric longitude shows a periodical change range of 0 to 2π. The planetary system heliocentric longitude shows a noticeable period of 180 years. Therefore, the planetary system heliocentric longitude has quasi periods of approximately 11.5 and 180 years.
4.2.3 Integrating Planet Juncture Index and Planetary System Heliocentric Longitude
Integrating the planet juncture index and the planetary system heliocentric longitude is necessary for studying the planetary system movement. Figure 7 shows the trajectory of the planetary system barycentre around the sun. Figures 7(C1) and 7(C2) are three-dimensional and floor charts, respectively. The sun lies at the origin of the X and the Y axes. The vertical axis represents time from 1900 A. D. to 2000 A. D.
|
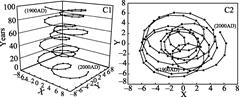
Figure 7 Trajectory of the centroid of the planetary system relative to the sun
|
|
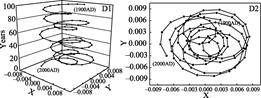
Figure 8 Trajectory of the sun centre relative to the solar system barycentre
|
Figure 8 shows the trajectory of the sun centre relative to the solar system barycentre. Figures 8(D1) and 8(D2) are three-dimensional and floor charts, respectively. The solar system barycentre lies at the origin of the X and the Y axes. The vertical axis represents time from 1900 A. D. to 2000 A. D. Figure 8 shows that the motion of the sun around the solar system barycentre exhibits marked periodic variations which are similar to that of the planetary system barycentre around the sun. A period of 11.5 years for the sun motion is observed over time from 1900 A. D. to 2000 A. D. It is similar to the periodicity of planetary system heliocentric longitude.
Table 3 Numbers of the solar system barycenter relative to the sun ontology during 1001 A. D.-2000 A. D.
|
Years (A. D.)
|
1001–1200
|
1201–1400
|
1401–1600
|
1601–1800
|
1801–2000
|
Total
|
|
Inside the sun ontology
|
64
|
69
|
63
|
76
|
73
|
345
|
|
Outside the sun ontology
|
136
|
131
|
137
|
124
|
127
|
655
|
When the sun is relative to the solar system barycentre, the solar system barycentre goes into periodic swirling into the sun ontology or rotates out of the sun ontology. The solar system barycentre is somewhere inside the sun ontology with a part time. The solar system barycentre is outside the sun ontology throughout the rest time. To improve the analysis accuracy, we calculate the positional relation between the solar system barycentre and the sun ontology from 1001 A. D. to 2000 A. D.
5 Discussion and Conclusion
The planet juncture index and the planetary system heliocentric longitude are two important kinematic indexes for the planetary system. Planet juncture index represents the distance between the planetary system barycentre and the sun barycentre. The planetary system heliocentric longitude represents the exact location of the planetary system barycentre relative to the sun. The base data of the variations of planet juncture index and heliocentric longitude for 2000 years are derived. A comparison between the base data of the two kinematic indexes shows that the two factors exhibit periodic trends and characteristics similar to those of the planetary system movement.
Author Contributions
Sun, W. and Wang, J. designed the algorithms of the dataset. Liu, F. Y., Wang, Y., and Chen, J. R. contributed to data processing and analysis. Sun, W. and Wang, J. wrote the data paper.
References
[1] Shi, G. C., Yao, G. J., Yang, B. Y., et al. Milankovitch theory of the Astronomical theory of climate change and predicting temperature change [J]. Publications of Purple Mountain Observatory, 1992, 11(2): 97-110.
[2] Shi, G. Y., Liu, Y. Z. Progresses in the Milankovitch Theory of Earth’s climate change [J]. Advances in Earth Science, 2006, 21(3): 278-285.
[3] Ding, Z. L. The Milankovitch Theory of Pleistocene glacial cycles: challenges and chances [J]. Quaternary Sciences, 2006, 26(5): 710-717.
[4] Sharp, G. J. Are Uranus & Neptune responsible for solar grand minima and solar cycle modulation? [J] International Journal of Astronomy Astrophysics, 2013, 3(3): 260-273.
[5] McCracken, K. G., Beer, J., Steinhilber, F. Evidence for planetary forcing of the cosmic ray intensity and solar activity throughout the past 9400 years [J]. Solar Physics, 2014, 286(2): 609-627.
[6] Scafetta, N., Milani, F., Bianchini, A., et al. On the astronomical origin of the Hallstatt oscillation found in radiocarbon and climate records throughout the Holocene [J]. Earth Science Reviews, 2016, 162: 24-43.
[7] Sun, W., Wang, J., Chen, J. R., et al. Contrast analysis between the trajectory of planetary system and the periodicity of solar activity [J]. Annales Geophysicae, 2017, 35: 659-669.
[8] Liu, F. G., Wang, J. Changes of the planet juncture index and solar revolution cycle around the mass center of the solar system [J]. Chinese Journal of Geophysics, 2013, 56(5): 1457-1466.
[9] Sun, W., Wang, J., Chen, J. R., et al. Variations of the planet juncture index and heliocen-tric longitude with spectral analysis for approximately 2000 years [J]. Chinese Science Bulletin, 2017, 62(5): 407-419.
[10] Sun, W., Liu, F. Y., Wang, J., et al. Dataset of planet juncture index and planetary system heliocentric longitude [DB/OL]. Global Change Research Data Publishing & Repository, 2018. DOI: 10.3974/geodb. 2018.05.09.V1.
[11] GCdataPR Editorial Office. GCdataPR data sharing policy [OL]. DOI: 10.3974/dp.policy.2014.05 (Updated 2017).
[12] Sun, W., Wang, J., Chen, J. R., et al. The modeling of the planet juncture index and heliocentric longitude of the centroid of planetary systems and numerical simulation [J]. Progress in Geophysics, 2017, 32(2): 506-515.
[13] Sun, W. Construction of the planetary system’s heliocentric longitude and contrast analysis between the trajectory of the planetary system and the solar activity—the factors of planetary movement drive on the global climate change [D]. Nanjing: Nanjing Normal University, 2017.