Development of
Ecological Vulnerability Classification 1-km Raster Dataset in Qinghai Province
of China (2015)
Zhi, Z. M1 Liu, F. G. 1,2* Chen, Q1,2 Zhou, Q1,2
1. School of Geographic
Science, Qinghai Normal University, Xining, Qinghai 810008, China;
2. Academy of plateau Science
and Sustainability, Xining, Qinghai 810008, China
Abstract: Qinghai province, an important part of
the Qinghai-Tibet Plateau, plays a critical role in establishing China??s
ecological security barrier and is of great ecological strategic importance. In
this study, we apply the ??SPR?? (ecological sensitivity-ecological
pressure-ecological resilience) model to Qinghai province, whose data is based
on three criterion levels of environmental concern, including ecological
sensitivity, ecological pressure, and ecological resilience. Collectively,
these conceptual ideas generate a total of 12 indicators. Among these
indicators, slope, elevation, and topographic relief have a resolution of 30 m
?? 30 m; while the indicators with a 1 km ?? 1 km resolution include: soil
erosion sensitivity, land degradation sensitivity, NDVI, average annual
temperature, average annual precipitation, population density, GDP density,
road density, and grazing intensity. The random forest method is used to determine
the weighting of these indicators to assess the ecological vulnerability of
Qinghai province. The study area was then divided into five vulnerability
levels: slight, mild, moderate, severe, and extreme. The final dataset has a
resolution of 1 km ?? 1 km and a .tif format, consisting of five files with 1.30
MB of data.
Keywords: Qinghai province;
ecological vulnerability; random forest; SPR model
DOI: https://doi.org/10.3974/geodp.2022.03.11
CSTR: https://cstr.escience.org.cn/CSTR:20146.14.2022.03.11
Dataset Availability Statement:
The dataset supporting this paper was
published and is accessible through the Digital Journal of Global Change Data
Repository at: https://doi.org/10.3974/geodb.2022.01.04.V1 or
https://cstr.escience.org.cn/CSTR:20146.11.2022.01.04.V1.
1 Introduction
In recent years,
with the intensification of global climate change and rapid socio-economic
development, the role of humans in the transformation of the natural
environment has increased rapidly. The human impact on the ecological environment
has become increasingly significant, and the relationship between humans and
nature has become tenser. Therefore, the assessment of ecological vulnerability
and its management has gradually received more attention from scholars in
ecology[1]. Currently, there are several definitions of ecological
vulnerability, but it is generally recognized that ecological vulnerability
mainly refers to the degree of internal response of an ecosystem to external
disturbances[2]. Ecological vulnerability can also be thought of as
the sensitive response and recovery state of a landscape system or ecosystem
under the conditions of external action at a specific temporal and spatial
scale and is represented by the performance of the properties possessed by the
system itself when subjected to disturbing effects[3]. The
assessment of regional ecological vulnerability can therefore provide an
effective reference for regional development and the promotion of healthy and
sustainable regional economic development.
Qinghai province is located in western
China, an important part of the Qinghai-Tibetan Plateau, belonging to the
Qinghai-Tibet alpine region. It is the source region of the Yangtze River, the
Yellow River, and the Lancang River, and its strategic ecological position is
very important. Since 2017, Qinghai province has been adhering to the
??ecological province?? strategy and building an ??ecological civilization
highland?? with a clear purpose. Therefore, the ecological vulnerability
assessment of the entirety of Qinghai province is of great importance. Based on
the ??SPR?? (ecological sensitivity-ecological pressure-ecological resilience)
model, this dataset is based on the three levels: ecological sensitivity,
ecological pressure, and ecological resilience, which have relevant and
measurable parameters of slope, elevation, topographic relief, soil erosion
sensitivity, land degradation sensitivity, NDVI, etc. The spatial distribution
of ecological vulnerability in Qinghai province is obtained through ArcGIS
spatial overlay analysis, which effectively clarifies the spatial distribution
of ecological vulnerability in Qinghai province. This dataset can illustrate
the spatial distribution of the ecological fragility in Qinghai province and
provide a base reference for the regional economic development direction of
Qinghai province.
2 Metadata
of the Dataset
The metadata from
the Ecological vulnerability classification 1-km raster dataset in Qinghai
province of China (2015)[4] are summarized in Table 1, which includes the dataset full
name, short name, authors, year of the dataset, spatial resolution, data
format, data size, data files, data publisher, and data sharing policy, etc.
3 Methods
The ecological
vulnerability grading data of Qinghai province is mainly based on the ??SPR?? model
to build the index system, which mainly includes an ecological sensitivity
layer, ecological pressure layer, and an ecological resilience layer. Based on
previous studies and taking into account the actual environmental
characteristics of Qinghai province and the availability of data, 12 indicators
were selected, including slope, elevation, topographic relief, soil erosion
sensitivity, land degradation sensitivity, NDVI, average annual temperature,
average annual precipitation, population density, GDP density, road density,
and grazing intensity, to build an ecological vulnerability assessment system[6?C9].
The random forest method was used to determine the weights of assessment
indicators. Then the data were superimposed by the ArcGIS spatial superposition
analysis tool to obtain the ecological vulnerability distribution data for
Qinghai province. Finally, the vulnerability was classified into five levels:
slight, mild, moderate, severe, and extreme, using the ArcGIS natural
breakpoint method consistent with the previous studies in the alpine region of
the Tibetan Plateau[10].
Table 1 Metadata summary of the Ecological
vulnerability classification 1-km raster dataset in Qinghai province of China
(2015)
|
Items
|
Description
|
|
Dataset
full name
|
Ecological
vulnerability classification 1-km raster dataset in Qinghai province of China
(2015)
|
|
Dataset
short name
|
EcoVul.Qinghai_2015
|
|
Authors
|
Zhi, Z. M. ABG-7100-2020, School of
Geographic Science, Qinghai Normal University,
zhizemin@126.com
Liu, F. G. L-8795-2018, School of Geographic Science,
Qinghai Normal University, lfg_918@163.com
Chen, Q. AAB-3346-2021, School of
Geographic Science, Qinghai Normal University, qhchenqiong@163.com
Zhou, Q. AAB-3351-2021, School of
Geographic Science, Qinghai Normal University, zhouqiang729@163.com
|
|
Geographical
region
|
Qinghai
province (31??36??N?C39??19??N??89??35??E?C103??04??E)
|
|
Year
|
2015
|
|
Temporal
resolution
|
Year
|
|
Spatial
resolution
|
1 km
??1 km
|
|
Data
format
|
.tif
|
|
|
|
Data
size
|
1.30
MB
|
|
|
|
Foundation
|
Ministry of Science and Technology of
P.R. China (2019YFA0606902)
|
|
Data
publisher
|
Global Change Research Data Publishing &
Repository, http://www.geodoi.ac.cn
|
|
Address
|
No.
11A, Datun Road, Chaoyang District, Beijing 100101, China
|
|
Data
sharing policy
|
Data from
the Global Change Research Data Publishing & Repository includes metadata, datasets
(in the Digital Journal of Global Change Data Repository), and
publications (in the Journal of Global Change Data & Discovery). Data sharing policy
includes: (1) Data are openly available and can be free downloaded via the
Internet; (2) End users are encouraged to use Data subject to
citation; (3) Users, who are by definition also value-added service
providers, are welcome to redistribute Data subject to written permission
from the GCdataPR Editorial Office and the issuance of a Data redistribution license;
and (4) If Data are used to compile new datasets, the ??ten per cent
principal?? should be followed such that Data records utilized should not
surpass 10% of the new dataset contents, while sources should be clearly
noted in suitable places in the new dataset[5]
|
|
Communication and searchable system
|
DOI, CSTR, Crossref, DCI, CSCD,
CNKI, SciEngine, WDS/ISC, GEOSS
|
3.1
Study Area
Qinghai province
(31??36??N?C39??19??N, 89??35??E?C103??04??E) is located in western China and in the
northeastern part of the Qinghai-Tibet Plateau. The topography is higher in the
west and lower in the east, higher in the north and south, and lower in the
middle, with an overall trapezoidal downward trend. The eastern part of the
province transitions from the Loess Plateau to the Qinghai-Tibet Plateau. The
northeastern part is an important agricultural area in Qinghai province, while
the terrain is complex and diverse to the south, with more than 80% of the area
characterized as plateau or mountainous; the western part is mainly a plateau and
basin, and the Qaidam Basin, one of the four major basins in China, is located
in the western part of Qinghai province. The entire province has a continental
climate with many rivers, including the Yellow River, Lancang River, Yangtze
River, Huangshui River, and Hei River. It is also home to the headwaters of the
Yellow River, Yangtze River, and Lancang Rivers. There are several nationally
protected areas in Qinghai province, including the ??Three Rivers Source?? Nature
Reserve, Coco Cili Nature Reserve, and Qaidam Nature Reserve. As a result, the ecological environment of Qinghai province is
very fragile due to its geographical location and climate. Due to the
importance of its strategic ecological position, the ecological security of
Qinghai province directly affects the ecological security of the entire
country, so it is very important to evaluate the ecological vulnerability of
this region.
3.2
Methods
The data mainly
refers to the ecological vulnerability assessment model developed by previous
authors[2,3], localizes the assessment indicators involved in the
model, calculates the weights for each criterion layer indicator separately,
based on the random forest model, and uses the ArcGIS spatial overlay analysis
tool to overlay the indicator and criterion layers to obtain the spatial
distribution dataset of ecological vulnerability in Qinghai province.
3.2.1 The
SPR (Sensitivity- Pressure-Resilience) Model
The SPR model was
proposed by Qiao et al. in 2008[11],
and the model is mainly used to comprehensively assess ecological vulnerability
in a given region. For a specific time period in a certain region, the internal
frame structure of the system has instability which is expressed as sensitivity
when it is disturbed by the outside environment. Such sensitivity develops in a
direction unfavorable to the system??s stability due to the lack of sufficient
coping capacity, and the system is subjected to pressure within the system to
show resilience. The SPR model contains three criterion layers, ecological sensitivity,
ecological pressure, and ecological resilience, and the selection of indicators
can be determined according to the actual characteristics of the region. Its
basic operational method is centered on the actual environmental
characteristics of the study area. In this way, the model indicators under the
three criterion layers are localized. The regional ecological vulnerability
index is obtained by assigning weights to the different indicators and
spatially superimposing different indicators based on the weighted values.
Finally, vulnerability classification is carried out according to the
classification method.
Ecological vulnerability is obtained from the graded ecological
frangibility index (EFI), which is calculated from ESI (ecological sensitivity index),
EPI (ecological stress index), and the ERI (ecological resilience index), where
ESI and EPI are positive indicators and ERI is a negative indicator. Its
calculation formula is given as follows:
EFI=ESI??Ws+EPI??Wp?CERI??Wr
(1)
where Ws represents the weight of
ecological sensitivity, Wp represents the weight of ecological pressure,
and Wr represents the weight of ecological resilience.
3.2.2
Random Forest Model
The random forest
(RF) model, a commonly used machine learning method, is a comprehensive deep
learning method[12], which has distinct advantages for solving
nonlinear problems[13] and serves as a data mining method using
categorical regression trees[12]. Its operating principle is to
obtain categories by integrating multiple decision trees and categorical
voting. At the same time, the method requires fewer arithmetic data. For the
study of multi-factor classifications, it can quantitatively provide the degree
of importance of the elements for the results, which is relatively more
objective and more accurate than other machine learning algorithms[14].
In particular, the RF method has a certain resistance to overfitting, as it can
reduce the risk of overfitting by averaging the decision trees, and it has a
high tolerance for noise and outliers generated in the model operations[13,14].
It can also measure the degree of importance of variables, which is a great
advantage for solving weighting class problems. Therefore, this study uses the
RF method to evaluate ecological vulnerability, mainly using the R studio
compiler in the R 3.3.3 environment to call the RF package for iterative
operations. The importance of each factor provided by the random forest method
determines the index??s weight, allowing for the processed data to be integrated
using the ArcGIS spatial superposition analysis tool to obtain the ecological
vulnerability grading data of Qinghai province.
3.3
Technology Line
In this dataset,
the three sub-goals of ecological sensitivity, ecological pressure, and
ecological resilience were constructed by selecting 12 indicators: slope,
elevation, topographic relief, soil erosion sensitivity, land degradation
sensitivity, NDVI, average annual temperature, average annual precipitation,
population density, GDP density, road density and grazing intensity, and the
weights of the sub-goals were determined based on the random forest model. The
ArcGIS spatial analysis tool was used to calculate the ecological sensitivity,
ecological pressure, and resilience of the three sub-objectives. Then the
random forest model was used to determine the weights of the three
sub-objectives for the main objective. Finally, ArcGIS spatial superposition
analysis was used to obtain the spatial distribution of the ecological
vulnerability index in Qinghai province, which was classified into extreme,
severe, moderate, mild, and slight based on the ArcGIS natural fracture
classification method (Figure 1).
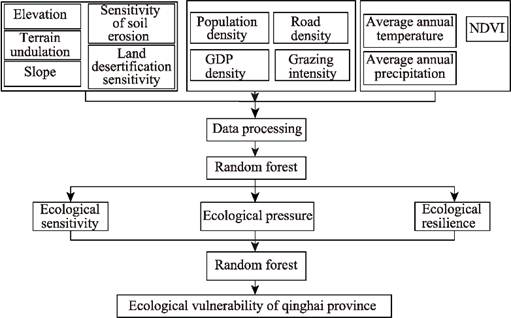
Figure 1 The flowchart of dataset development
4 Data Results and Validation
4.1
Data Composition
The original
format of this data was mostly raster. The administrative division data and
road data (vector) of Qinghai province are from the 2017 national geographic
resources directory service system
(https://www.webmap.cn/main.do?method=index). The road density data (raster),
also from 2017, are obtained from the ArcGIS ??density analysis?? tool, with a
spatial resolution of 1 km ?? 1 km. The year-end livestock data came from the
statistical yearbook of Qinghai province cities (states) and the statistical
bulletin of national economic and social development (2016), where the grazing
intensity is defined as the number of livestock per unit grassland area. The
elevation data are obtained from the geospatial data cloud platform
(http://www.gscloud.cn/home), and the slope and topographic relief are obtained
through elevation data extraction, with a data resolution of 30 m ?? 30 m,
sampled by ??resampling?? tools to 1 km ?? 1 km. The 2015 soil erosion sensitivity
and land desertification sensitivity data (resolution of 1 km ?? 1 km) were
obtained from the Ecological Environment Research Center of the Chinese Academy
of Sciences (http://www.rcees.ac.cn/). The
2015 data for the normalized vegetation index (NDVI), average annual
precipitation, average annual temperature data, population density data, and
GDP density were obtained from the Resource and Environment Science Data Center
of the Chinese Academy of Sciences (https://www.resdc.cn/) with a 1 km ??1 km
resolution.
4.2
Data Products
Based on the
temporal distribution of the original data, the ecological fragility grading
assessment data of Qinghai province is defined for the year 2015, and the
spatial domain is the entirety of Qinghai province. The fragility grading
assessment results show that the ecological fragility grading of Qinghai
province has the highest proportion of light fragility, mainly distributed in
the Qinghai Plateau and the T??ang- ku-la Mountain region, whose area accounts
for 36.33% of the area of Qinghai province. The smallest proportion consisted
of extremely fragile areas, mainly distributed in the Yellow River-Huangshui
River Valley agricultural area and the Qaidam Basin. Coincident with the most
intense human activities in Qinghai province, human interference in the Yellow
River-Huangshui River Valley has a greater impact on the ecological
environment; thus, the ecological pressure is more prominent. This is followed
by the poor natural environment of the Qaidam Basin, with an annual
precipitation shortage and serious desertification, which has also become an
extremely fragile ecological area, compromising 8.51% of extremely fragile areas. The remaining slightly fragile and
moderately fragile areas have similar proportional areas, accounting for 19.69%
and 21.43%, respectively, and the percentage of the area of the severely
vulnerable areas is relatively small at 14.05%[15] (Figure 2).
Overall, the ecological vulnerability of
Qinghai province shows a distribution characteristic of high in the north and
low in the south; high in the east and low in the west. In the east, the
population density is relatively high; consequently, the intensity of human
activities is high. Thus, the conflict between humans and land is significant,
and the ecological pressure on the system is high. However, in the west, the Qaidam
Basin is an important energy supply base for Qinghai province and even for the
whole country. While the GDP density is relatively high, the environment is
harsher, so the vulnerability level is higher. In the south, the area is mainly
pastoral; therefore, the population densities less within a relatively healthy
natural environment, justifying a relatively low vulnerability level.
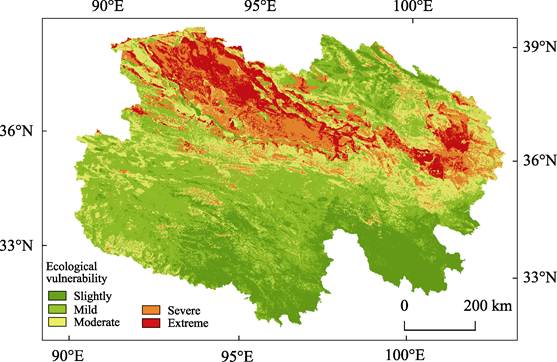
Figure 2 Ecological vulnerability classification
in Qinghai province
4.3 Data Validation
The overall
accuracy of the random forest model served as the main focus for data
validation. In terms of the three sub-goals of ecological stress, ecological
resilience, and ecological sensitivity in the model iteration and the final
ecological vulnerability target calculation, the R2 of the
random forest model was above 0.95, and the overall error was less than 0.05.
Therefore, the model??s overall accuracy is high, and the data results are
reliable to a certain extent.
5 Discussion and Conclusion
We applied a
random forest model to construct the ecological vulnerability classification
data of Qinghai province based on three index layers of ecological sensitivity,
ecological pressure, and ecological resilience. The following parameters drove
the model: altitude, slope, topographic relief, soil erosion sensitivity, land
desertification sensitivity, NDVI, average annual temperature, average annual
precipitation, population density, GDP density, road density, and grazing
intensity, each of which was assigned weights by the random forest method. The
ecological vulnerability distribution data of Qinghai province were obtained by
superimposing the indicators through an ArcGIS spatial analysis.
With the deepening of ecological
vulnerability evaluation research, the selection of vulnerability evaluation
indicators has gradually matured. Still, due to the accessibility of some
indicators, this dataset can only calculate the spatial distribution
characteristics of ecological vulnerability in Qinghai province for 2015. The
effectiveness of future research can be improved if some indicators with poor
accessibility are replaced by other proxy indicators or prepared by certain
methods to improve the effectiveness of the research.
Author Contributions
Liu, F. G. first proposed the ideas and thoughts of the
paper; Chen, Q., and Zhou, Q. adjusted the general framework of the paper; Zhi,
Z. M. designed the dataset??s development and collected, processed the original
underlying data, and wrote the paper.
Conflicts of Interest
The
authors declare no conflicts of interest.
References
[1]
Tian, Y. P., Chang, H. Bibliometric analysis of research progress
on ecological vulnerability in China [J]. Acta Geographica
Sinica, 2012, 67(11): 1515?C1525.
[2]
He, Y. L., Yuan, Y. M., Wang, T., et al. Integrated assessment of marine ecological vulnerability in
the Yangtze River Estuary using GIS [J]. Acta Ecologica Sinica, 2019, 39(11): 3918?C3925.
[3]
Wang, R. H., Fan, Z. L. Ecological fragility assessment on
continental river basin in arid zone taking Tarim River Basin, Xinjiang as an
example [J]. Chinese Journal of Ecology, 2001, 20(3): 63?C68.
[4]
Zhi, Z. Z., Liu, F. G., Chen, Q., et al. Ecological vulnerability classification 1-km raster dataset
in Qinghai province of China (2015) [J/DB/OL]. Digital Journal of Global Change Data Repository, 2022. https:// doi.org/10.3974/geodb.2022.01.04.V1.
https://cstr.escience.org.cn/CSTR:20146.11.2022.01.04.V1.
[5]
GCdataPR Editorial Office. GCdataPR data sharing policy [OL].
https://doi.org/10.3974/dp.policy.2014.05 (Updated 2017).
[6]
Xue, L. Q., Wang, J., Wei, G. H. Dynamic evaluation of the
ecological vulnerability based on PSR modeling for the Tarim River Basin in Xinjiang [J]. Journal of Hohai University (Natural Sciences), 2019, 47(1): 13?C19.
[7]
Liu, Z. J., Yu, X. X., Li, L.,
et al. Vulnerability assessment of eco-environment in Yimeng mountainous
area of Shandong province based on SRP conceptual model [J]. Chinese Journal of
Applied Ecology, 2011, 22(8): 2084?C2090.
[8]
Lu, H. Y., Sun, G. L., Li, L.,
et al. Ecological vulnerability assessment in Xinjiang based on VSD model [J]. Xinjiang Agricultural Sciences, 2020, 57(2): 292?C302.
[9]
Zhang, Q., Li, M. Y. Regional ecological vulnerability assessment
based on VSD Model??the case of Yanbian Korean autonomous prefecture [J]. Agricultural Science
Journal of Yanbian University, 2018, 40(4): 7?C15.
[10]
Yu, B. H., Lv, C. H. Assessment of ecological vulnerability on the
Tibetan Plateau [J]. Geographical Research, 2011, 30(12): 2289?C2295.
[11]
Qiao, Q., Gao, J. X., Wang, W., et al. Method and application
of ecological frangibility assessment [J]. Research
of Environmental Sciences, 2008, 130(5): 117?C123.
[12]
Breiman, L. Random forests [J]. Machine Learning, 2001, 45: 5?C14.
[13]
Reichstein, M., Camps-Valls, G., Stevens, B., et al. Deep learning and process understanding for data-driven
earth system science [J]. Nature,
2019, 566(7743): 195?C204.
[14]
Fang, K. N., Wu, J. B., Zhu, J. P., et al. A review of technologies on Random Forests [J]. Journal of Statistics
and Information, 2011, 26(3): 32?C38.
[15]
Zhi, Z. M.,
Chen, Q., Liu, F. Ecological vulnerability assessment based on SPR model: a
case study of Qinghai province [J]. Journal
of Qinghai Environment, 2020, 30(4): 186?C190.