Experimental Study on Optimization of Population
Density Models Based on Random Forest
Liu, Y.1
Yang, X. J.1 Liu,
J. S.1, 2, 3, 4*
1. College of Resources and Environmental Sciences, Hebei Normal University,
Shijiazhuang 050024, China;
2. Hebei Key Laboratory of Environmental Change and
Ecological Construction, Shijiazhuang 050024, China;
3. Hebei Technology Innovation Center for Remote Sensing Identification of Environmental Change,
Shijia-
zhuang 050024,
China;
4. Geographic Experiment Teaching Demonstration Center of
Hebei Province, Shijiazhuang 050024, China
Abstract: Population
density is a quantitative index useful to represent the characteristics of a
regional population distribution. For the last 30 years, gridded population
density models have developed into an important research area in population
density, and there have also been a ??Top-down demographic census data
decomposition algorithm?? and a ??Bottom-up demographic survey data estimation
algorithm??. Density models based on random forest (RF) modeling have been the
focus of much recent attention. In this study, Shijiazhuangcity is taken as an
example. A preliminary comparison of multiple population density datasets revealed
persistent problems, namely those of an ecological fallacy, Modifiable Areal
Unit Problem (MAUP), confusion in population density patterns, and less than
meticulousness in impact factor selection, among others. An optimization scheme
of the models is explored in order to address the problems. In this respect, it
is proposed here that random forest population density models be constructed
with endowment zoning as the modeling unit, to mitigate confusion concerning
the population distribution patterns. Random sampling can
be applied using a hectare grid as the sampling unit, to both avoid an ecological
fallacy and to overcome the effects of MAUP on the quality of samples. Mapping
tests for the selection of impact factors can be constructed on a per zone
basis, to avoid introducing the wrong factors into the models. This optimization
scheme thus provides a more systematic approach to enhancing the reliability
and validity of population density models.
Keywords: population density; random
forest models; random sampling; Shijiazhuang
1 Introduction
Population density is a quantitative index widely used to
represent the population distribution characteristics in a region, and a
population density map is a fundamental basis for revealing population
distribution patterns. Changes in population density may have important effects
on regional politics, culture, resources, and environment, as well as other
aspects[1], and may be also a key driving factor in global land
cover changes[2–3]. Therefore, population density research is
important fundamental work not only for the discerning of population density
patterns, but also for the assessing of global change effects and disaster risk
levels and formulating land space planning strategies, optimizing resource
allocation[4].
Before the 1990s, vector-format population density maps had
been used in all countries of the world to represent their populations??
distribution characteristics. It was difficult to compile the vector format
global population density maps with synchronized population data because of the
low population census data-acquisition frequency (i.e., in many countries, one
census is conducted every 10 years), low time efficiency, and inconsistent pace
(disruptions from wars, plagues or other factors, left some countries unable to
release census data as scheduled, or the delaying of the release)[5–6].
The
vector population density maps generally were adopted the administrative division
or latitude-longitude grid as the population statistical unit[7–8].
But neither of them matches the natural geographical unit (watershed, transect,
and others) in terms of shape, size, location, and other relevant scales. In
general, the conversion operation to derive population density is disturbed by
the Modifiable Areal Unit Problem (MAUP)[9–10]. It is assumed in vector-format
population density maps that there is a uniform population density within the
mapping units, which inadvertently conceals the true heterogeneity of all
population distribution within them. For these two reasons, the real population
distribution pattern is often distorted by the vector-format population density
maps[11], leading to a major undermining of the overlay analysis of
population distribution along with natural, resource, environmental and other
associated issues[5]. Because raster-based analytical models are
needed in global change research, the Working Group 3 of The Human Dimensions
of Global Environmental Change Programme (HDP) advocated for the development of
a global-gridded population density map in the early 1990s[12].
2 Population Density Datasets
Typical population density datasets covering the whole
world mainly include those of GPW (Gridded Population of the World), GRUM
(Global Rural Urban Mapping Project), LandScan (LandScan Global Population
Database), GHS-POP (Global Human Settlement Layer -Population), WPE (World
Population Estimate), WorldPop, and HYDE (History Database of the Global
Environment Population Grid). In China it is mainly the dataset of CnPOP (Table
1).
The
Center for International Earth Science Information Network (CIESIN), affiliated
with Columbia University, is a research institution that compiles
global-gridded population density datasets[13]. It not only
independently produced the GPW population density datasets, but also jointly
compiled the GRUMP, GHS-POP and WPE population density sets in cooperation with
other scientific research institutions. CIESIN has produced population datasets
with an areal-weighted model, now in its fourth version, which provides global
population density datasets for the years 2000, 2005, 2010, 2015, and 2020, at
a spatial resolution of 30 arcsec (ca. 1 km) CIESIN, in collaboration with the
International Food Policy Research Institute (IFPRI), the World Bank, and the International
Center for Tropical Agriculture (CIAT), has produced the GRUPM population
density datasets via linear regression modeling, but there is only a first
version of this. It provides global population density datasets for years 1990,
1995, and 2000, at a spatial resolution of 30 arcsec (ca. 1 km)[14].
The
European Commission Joint Research Centre (JRC), in collaboration with CIESIN,
produced GHS-POP population density datasets based on a linear regression
model, providing global population density datasets for years 1975, 1990, 2000,
and 2015 at four different spatial resolutions[15] (250 m, 1 km, 9
arcsec, and 30 arcsec, respectively).
The Environmental
Systems Research Institute (ESRI), in collaboration with CIESIN, produced WPE
population density datasets from a linear regression model, providing global
population density datasets for years 2013, 2015, and 2016. Those of 2013 and
2015 are at a spatial resolution of 250 m, and that of 2016 datasets is at 150
m[16].
The Netherlands Environmental
Assessment Agency (PBL) produced HYDE population density datasets through
linear regression modeling, which has evolved into a version 3.2. It provides
global population density datasets from 10,000 years BC to 2016 AD, with one dataset
provided for every 1,000 years spanning 10,000 to 1,000 years BC, followed by
one dataset every 100 years from 0 AD to 1700 AD, then one set every 10 years
from 1700 AD to 2000 AD, and most recently, with one dataset per year from 2000
to 2016. All these datasets are at a spatial resolution of 5 aremin (ca. 10 km)[17].
Datasets from HYDE play a prominent role in the study of global change. The Oak
Ridge National Laboratory (ORNL) produced LandScan population density datasets
from a linear regression model, providing the annual global population density
datasets for the years 2000 through 2019, at a spatial resolution of 30 arcsec
(ca. 1 km)[18]. The WorldPop, affiliated with the University of
Southampton, produced WorldPop population density datasets generated using a
random forest model, providing one dataset yearly from 2000 to 2020, at a
spatial resolution of 30 arcsec (ca. 1 km)[19]. The Institute of
Geographic Science and Natural Resources Research, Chinese Academy of Sciences
(IGSNRR, CAS), produced CnPop population density datasets through linear
regression modeling, providing datasets from 2005 and 2010 of China??s population
density, at a spatial resolution of 1 km[20-21].
The
above-mentioned seven major global population density sets (GPW, GRUMP, LandScan,
GHS-POP, WPE, HYDE, WorldPop) have been widely applied in disaster risk assessment[22–25],
land-use change[26–28], public health management[29–31] and
human influences on environmental changes[2, 32–35], playing a
fundamental supportive role in studies of global change and environmental
governance.
Scholars
agree that the WorldPop population density datasets based on a random forest
modeling are distinguished by higher validity[4, 36–37]; hence,
population density models using a random forest approach show significant
advantages. In the past 30 years, Chinese scholars have also developed several
gridded models of population density[8, 10, 37–51]. But to date they
have been only applied to China or a certain region in it. In fact, a dataset
independently produced by Chinese research institutions that can encompass
global population density data has yet to be produced.
3 Gridded
Population Density Models
In the past 30 years, several gridded population density
models have been developed, for which two categories have gradually formed: a
??top-down demographic data census algorithm?? or a ??bottom-up demographic survey
data estimation algorithm??[52].
3.1
Top-down
Demographic Census Data Decomposition Algorithm
??Top-down demographic census data decomposition algorithm??
is an algorithm applied to countries or regions with good population censuses,
with which the regional population total, based on deductive rules, is
decomposed into individual grid, covered by the census (or population
registration) units. Such algorithms mainly include an areal-weighted model[8,
43, 47, 53], distance decay model[38, 40, 42, 45, 54], linear
regression model[2, 39, 41, 43, 46, 48-49, 55–60], or a random forest model[6, 37, 50–52, 61–62].
Table 1 Population density datasets availability (referring to[4],
with modifications)
|
Datasets
|
Development institution
|
Algorithm
|
Spatial
resolutions
|
Year of mapping
|
Data sharing websites
|
|
GPW v4.11
|
CIESIN
|
Areal weighted model
|
30 arcsec
(ca.1 km)
|
2000; 2005
2010; 2015
2020
|
https://sedac.ciesin.columbia.edu/data/collection/gpw-v4
|
|
GRUMP v1
|
CIESIN, IFPRI
The World Bank; CIAT
|
Linear regression model
|
30 arcsec
(ca.1 km)
|
1990; 1995
2000
|
https://sedac.ciesin.columbia.edu/data/collection/grump-v1
|
|
GHS-POP
|
JRC; CIESIN
|
Linear regression model
|
250 m
|
1975; 1990
2000; 2015
|
https://ghsl.jrc.ec.europa.eu/ghs_pop.php
|
|
WPE
|
ESRI; CIESIN
|
Linear regression model
|
250 m
250 m
150 m
|
2013
2015
2016
|
https://sites.google.com/ciesin.columbia.edu/popgrid/find-data/esri
|
|
HYDE v3.2
|
PBL
|
Linear regression model
|
5 aremin
(ca. 10 km)
|
10 000 BC–2016
|
https://themasites.pbl.nl/tridion/en/themasites/hyde/download/index-2.html
|
|
LandScan
|
ORNL
|
Linear regression model
|
30 arcsec
(ca. 1 km)
|
2000–2019
|
https://landscan.ornl.gov/
|
|
WorldPop
|
WorldPop, University of Southampton
|
Random forest model
|
30 arcsec
(ca. 1 km)
|
2000–2020
|
https://www.worldpop.org/
|
|
CnPOP
|
IGSNRR, CAS
|
Linear regression model
|
1 km
|
2005; 2010
|
https://doi.org/doi:10.3974/geodb.2014.01.06.V1
|
3.1.1 Areal-weighted Model
Areal-weighted models are popular
to be used. CIESIN has compiled the GPW with this model, lending it the
advantage of being applicable in the scaling-down calculation of population
density. For example, the block population vector datasets can be obtained by
scaling down on the basis of the village population vector datasets of Shijiazhuang
city. Then the minimal granularity population density datasets can be obtained
by further scaling down on the basis of the block population vector datasets
(Figure 3a). On the basis of the minimal granularity population density datasets,
a scaling-up calculation of the population density can be applied with circular filtering algorithm; in this way, the MAUP problem in multi-scaled population density
scaling can be systematically explored and the theory of the regional
population distribution can be qualitatively constructed[47]. The disadvantage
to using this model, however, is that the heterogeneity of the population
density within the grid is concealed when the gridded area is large.
3.1.2 Distant Model
Distant
decay model is suitable for depicting the population distribution
characteristics for towns and their surrounding areas. But if the applicable
conditions of the model are neglected, and they are extended to the calculation
of the population density of all the regions (including villages), the validity
of population density maps will be significantly reduced. This model implements
an interpolation algorithm, which takes into account the distance factor, yet
lacking the capability of quantitatively interpreting the mechanisms influencing
population density.
3.1.3 Linear
Regression Model
Linear regression model is used to generate the population
density datasets produced in GRUMP by CIESIN[14], GHS-POP by JRC and
CIESIN[15], LandScan by ORNL[18], and WPE by ESRI[16],
HYDE by PBL[17], and also in the CnPOP compiled by The Institute of
Geographic Science and Natural Resources Research, Chinese Academy of Sciences[20-21].
This
group of models was taken into account the factors impacting population density.
Due to differences regarding the factor type, the number of factors considered,
and their introduction mode among various models, the resulting gridded
population density datasets can differ significantly (Table 2). Such models,
with the help of impact factors, are suited to construct population density
datasets for countries or regions without empirical population census data. But
the criterion validity of such models is not high (When calculating the population
density via different models, one population
density dataset is set as the criterion to which other sets are compared, whose
correlation coefficient defines this criterion validity). Population density
datasets compiled using such models generally have the problem of underestimating
population density in urban areas while overestimating it in rural area[37,
63], which calls into question the assumption of a linear dependency
between population density and its impact factors. In 2015, the Sustainable
Development Goals (SDGs) held that the reliability (the consistency or
stability of results obtained with the same model) and the validity (the
accuracy of the population density obtained with the model) of this linear
modeling approach needed improvement in the process of integrating data on
population, resources, and the environment[6].
3.1.4
Random Forest Model
During the last 5 years, random forest model has been
adopted by integrating worldwide geographical data, with nonlinear dynamics in
the gridded population density model, which generally leads to a improvement in
the quality of the population density datasets. Random forest model is an
integrated algorithm in machine learning that excels at making nonlinear
calculation[64]. The ??trees?? in the random forest are classification
and regression trees (CART) constructed with training subsets of datasets, each
of which is trained with the subsets constructed randomly via bootstrapping the
total training sample dataset. Each CART tree is adopted to divide the mapping
area into several ??type areas??, with the population distribution probability
value of each type area being the average population density of all samples
that fall into that area. Assuming that n
CART trees are generated in the forest, it is equivalent to the formation of n independent space segmentation schemes
in the graphical area. To each grid, n
population distribution probability values are allocated, and their arithmetic
mean per grid (i.e., the projected population distribution probability value
for each grid) is then calculated. Apparently, this projected population
distribution probability value always lies between the highest and lowest ones
in the total training sample datasets. The Out-Of-Bag (OOB) data are also
adopted in the model to measure the importance of the impact factor for
population density: the greater the importance value of an impact factor is,
the higher its importance will be. Because the model can be used to accurately
depict the nonlinear relationships between population density and its impact
factors, and to rank them in importance, it has the potential to select key impact
factors acting on population density. It has become the mainstream algorithm in
the production of gridded population density datasets. Random forest modeling
is used by the University of Southampton of the UK in the compilation of the
WorldPop population density datasets in the global scale[19].
3.2
Bottom-up Demographic Survey Data Estimation Algorithm
It is assumed that population distribution patterns in a
country lacking a population census are similar to that in surrounding
countries with a census, the former??s impact factor datasets could be
substituted into the random forest-based population density model of the
neighboring countries, thus enabling the compilation of population density
datasets for countries without a population census. To do so, population density
model had been used random forest with a ??bottom-up demographic survey data
estimation algorithm??.
This
??bottom-up demographic survey data estimation algorithm?? is a process in which
a number of typical, miniature community population surveys are conducted in
countries or regions for which no population census is available, and then
combined with population density impact factor datasets for those sampled
communities. The training data subsets are constructed with the communities as
sampling units, and random forest models are then obtained through training.
Assisted by the information in impact factor datasets, population density
datasets are produced for countries and regions that currently lack a
population census[52].
3.3
Confusion in Selecting the Relevant Impact Factors
With the advent of geographic data, the impact factor
datasets introduced into the gridded population density models have gradually
increased (Table 2). In the creation of the LandScan, WorldPop, and HYDE
datasets, the influences from natural conditions are taken into account, by
incorporating datasets of annual mean temperature, annual precipitation, DEM
(digital elevation model), topographic relief, land cover, and water bodies. In
creating the LandScan, WPE and WorldPop datasets, the impacts of roads are
taken into account, and the WorldPop dataset also adopts point-of-interest
(POI) datasets[65], to assess the impact of production, living, and
consumption facilities. Because the impact factors introduced into population
density models differ in terms of type, number of them used, and their introduction
mode, the ensuing datasets produced by differing models tend to be
significantly different. It follows that if these different datasets are
consulted for the same project, their conclusions also tend to be inconsistent
with each other[36, 66–69].
Table 2 The
impact factors selected by the typical population density datasets
(referring to [4], with modifications)
|
Gridded population datasets
|
Population density
|
Impact factors acting on population density
|
|
Roads
|
Land cover
|
Construction structure
|
Urban
|
Luminous images
|
Infrastructure
|
Conservation areasa
|
Natural conditionsb
|
Water bodies
|
|
GPW
|
x
|
|
|
|
|
|
|
x
|
|
x
|
|
GRUMP
|
x
|
|
|
|
x
|
x
|
|
x
|
|
x
|
|
LandScan
|
x
|
x
|
x
|
x
|
x
|
|
x
|
x
|
x
|
x
|
|
GHS-POP
|
x
|
|
|
x
|
|
|
|
|
|
|
|
WPE
|
x
|
x
|
x
|
|
x
|
|
|
|
|
x
|
|
WorldPop
|
x
|
x
|
x
|
x
|
x
|
x
|
x
|
x
|
x
|
x
|
|
HYDE
|
x
|
|
|
|
|
|
|
|
x
|
x
|
|
CnPOP
|
x
|
|
x
|
|
|
|
|
|
|
x
|
Notes: a Conservation areas are not
excluded from the calculation mask, but there is often zero population in these
areas or no data; b Natural conditions include climate, topography,
altitude, and so on.
Insufficient
data has long limited the process of developing gridded population density
models. To produce the world??s population density datasets, each research institution
must abide by the principle of data availability, and evidently the impact
factors introduced into the early gridded population density models were
inevitably the product of a mutual compromise between task progress and data
availability. But with the gradual improvement of geospatial data and the rapid
development of spatial location services, both LandScan and WorldPop are no
longer severely hindered by a shortage of impact factor datasets (Table 2). Then
the questions are: which impact factors should be introduced into the gridded
population density models? And how should they be introduced? Currently lacking
are both theoretical guidance and a means for this selection, readily apparent
in such questions as follows: What theory should be adopted to guide the
selection of impact factors? What are the key factors impacting population
density? Do various factors all have an impact on the global scale? Is it necessary
to select factors by region? And if regional partitioning is needed, what would
be the guidance for doing so?
4
Experimental Study on the Optimization of Population Density Models Based on
Random Forest
Here, take Shijiazhuang region as a case study to carry out
how to optimize population density models by using random forest.
4.1
General Information about the Research Region
Shijiazhuang region (including Xinji) has 12 counties, 5
county-level cities and 1 state-level high-tech development district. There are
208 townships and 64 sub-district offices, and 192 neighborhood committees, and
4,317 administrative villages. Its registered population is 9.43 million
inhabitants, of which 2.32 million live in its urban areas (with 97,300 in the
Jingxing mining district).
The rural
population datasets were provided by the Shijiazhuang Municipal Public Security
Bureau, with the summarizing time at 0:00 on May 1st, 2007. The registered
population information included village names, total household number, total
population, male population, female population, non-agricultural population,
and agricultural population. Village boundary and block vector datasets came
from the Hebei Provincial Department of Land and Resources (2006 edition).
Place names data were provided by Shijiazhuang office of place names.
4.2
Exploratory Experimental Study on Random Forest-Based Population Density Models
The minimum granularity population density map (Figure 3a)
was obtained with an area-weighted model, by scaling down (Figure 1). The R = 12 population density map (Figure
3b)—which used a filtering radius of 1.2 km—was obtained from a circular filtering
model by scaling up, based on the minimum granularity population density map
(Figure 1).

Figure 1 Flow chart for building the multi-scale
population density map
The grounded theory of
population distribution in Shijiazhuang region can be summarized as follows (Figure
3b.): (1) Rivers have a significant impact on surrounding population density.
To avoid flooding disasters, both sides of natural rivers in plains are usually
areas with a low population density; in contrast, for the convenience of gathering
water, both sides of natural rivers in mountainous places are usually areas
with a high population density. (2) Artificial rivers (distributaries,
irrigation systems, and so on) have no significant effects on surrounding
population density. (3) There is a high population density in the plains and
low population density in the mountains. (4) There is high population density
in cities and low population density in the countryside. (5) Both sides of the
abandoned ancient natural rivers in Ming and Qing Dynasties are still areas
that feature a low population density.
Figures
3c, 3d, and 3e were all obtained through calculations made with random forest- based
population density models (Figure 2). They differ in that Figures 3c and 3d
were obtained by sampling at the township level based on registered population
data in 2007, while the Figure 3e was obtained by sampling at the county level based
on census data in 2010[19].
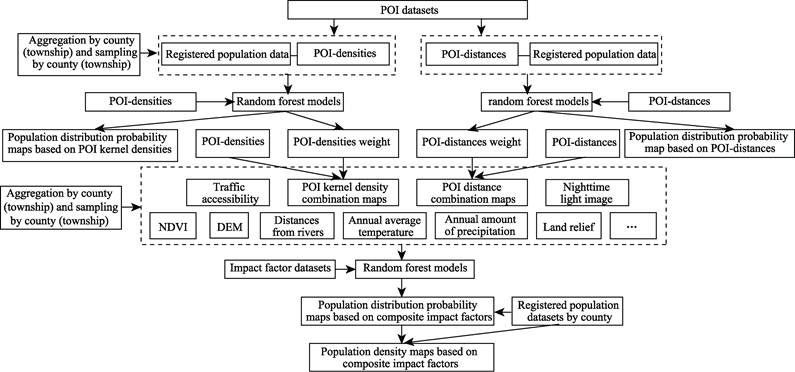
Figure 2 The calculation process of a population
density model based on random forest methods
A
phenomenon of mixed population distribution patterns was revealed by population
density maps calculated using the random forest modeling approach (Figure 3d).
This is the inevitable result of mixing the mountain and plain training samples
in training sample datasets when the random forest-based population density
models are constructed. Such problems can be overcome, at least theoretically,
if mountain and plain areas are separated and respectively sampled, so that
random-forest-based population density models can be constructed by zoning them
accordingly.
If
population density or an impact factor aggregation operation is conducted according
to the administrative division units of county, township, and village, datasets
of population density and impact factors in training samples must be obtained
via an aggregation operation (Figure 2); hence, the quality of the training
sample data will be disturbed by MAUP. For example, population density is a
form of spatial constant-ratio data, whose values often vary with the
statistical unit area used, a phenomenon known as the plasticity unit area of
population density.
The
sampling units of population density models based on random forest are mostly
county, township, or other administrative division units, while the output
units are mostly the kilometer grid or hectare grid. Theoretically, this
phenomenon of using the analysis unit of one community to collect data while
using that of another community to draw conclusions is likely to lead to the ecological
fallacy problem. In population density models that are based on random forest
methods (Figure 2), there is not any analysis into how or why impact factor
datasets are introduced. (1) If both artificial and natural rivers are
introduced indistinctly as river factors, the calculation results for sides of
artificial rivers will be either low or high (Figure 3d and Figure 3e), which
does not conform to the grounded theory of population distribution displayed in
Figure 3b. (2) If nighttime light image is presumed to be an impact factor, a
difficult problem ensues of how to overcome the blooming effect of luminous
images. (3) When only 24 POI distance factors are adopted as those of impacting
population density, the obtained population distribution probability map is
nonetheless able to quantitatively depict the point-axis distribution
characteristic of the given population (Figure 3c); this shows that the POI
distance combination dataset can very well represent innovation endowment
features. If they are adopted to replace nighttime light image factor, it is
possible that the ??blooming effect?? of luminous images could be overcome.
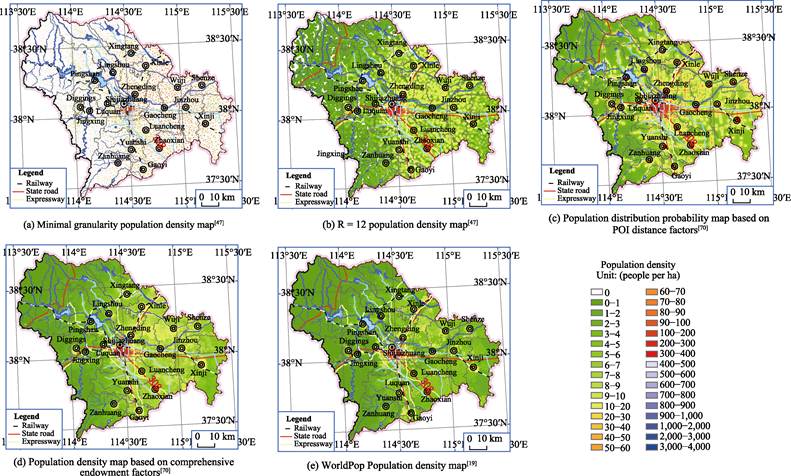
Figure 3 Map
of typical population density and population distribution probability
5 Discussion
and Conclusion
5.1 Discussion
5.1.1 The Issue of
Constructing Gridded Population Density Models by Zoning Method
As early as the 1980s, Mr. Hu, Huanyong clearly proposed
that not only is comprehensive research needed to explore the patterning of
population distributions, but proper partitioning is also essential for
investigating population distribution and development patterns[69].
Hu reckoned there is an interaction among the human population, natural
resources, the economy, and science and technology. Accordingly, they must be
sufficiently integrated and coordinated that it would be of little value to
separately calculate any single factor With this in mind, Hu divided China into
three belts and eight zones and predicted their respective population
development[71–73]. Hu??s zoning idea in the study of population
geography coincides with the regional system theory of human–earth relations[74–77]
and the theory of evolutionary economic geography[78–80], pointing
to the direction and path that would deepen the study of population density.
The zoning idea should be adopted in the optimization of the random
forest-based population density models and in the selection of impact factors
that could act on populations.
The
natural geographic regionalization unit has served as the basis for knowledge exploration
with data on geographical spaces. It goes beyond merely a regional division, in
also being a scientific method to understand geographic features and to
discover geographical patterns[81]. Regionalization, by zoning
places with the same geographical features together and categorizing places
with different features into another zone, not only avoids the defects of
fragmentation but also the trouble of repeated exposition[82]. Natural
geographic regionalization unit has thus become the subject and basis of
exploring knowledge with geospatial data in the age of information[81].
Population distribution is the historical accumulation of regional man–land
elements?? co-evolution. The divergences in an integrated regional endowments
and population development paths may lead to different population density-impacting
mechanisms operating in different social development stages. Therefore, to
optimize population density models based on random forest, our academic
tradition of natural geographic regionalization should be innovated by the
construction of advanced population density models, enabling us to compile
population density maps and to explain population distribution patterns and
population development patterns by region[83].
5.1.2 How to Select Population Density Impact Factors Consistent
with the Theory of Evolutionary Economic Geography
Evolutionary economic geography holds the view that in the
age of agricultural civilization, natural endowments—altitude, surface
roughness, water resource suitability, agricultural, agricultural potential
productivity, annual mean temperature, annual precipitation, and annual
evaporation—were the major factors determining regional development, whereas in
the age of industrial civilization, economic endowments (i.e., traffic location
and city location) were the major factors driving regional development. In the
age of information civilization, it is innovation endowments (knowledge,
technology, network, policy, system) which are the major factors shaping regional
development[80]. Hu Huanyong Line[7] was the inevitable result
of the land-locking effect of natural endowments upon regional development in
the age of agricultural civilization, being a classic case of natural
endowments?? (especially water resources) controlling population distribution
patterns. In the age of industrial civilization, the comparative cost of
transportation in half of northwest China was neither reduced nor was the
constraint of water shortage alleviated. In the age of information civilization,
innovation endowments in half of northwest China still display a point-axis
distribution pattern and the comprehensive constraints of these endowments are
the fundamental reason for the ??Overall stability of Hu Huangyong Line and the
local adjustments of the east and west halves?? in the past 70 years[84–90].
The population density optimization models based on random forest algorithms
should inherit the classical results of comprehensive zoning[91–92].
The theoretical results of evolutionary geography should be combined with the
development stage of the region, center around natural, economic and innovation
endowments adopt a combined qualitative and quantitative method and select
population density impact factors. It is anticipated that Chinese population
geographers will play an active role in optimizing such population density
models by integrating multiple research paradigms and conducting complex
geographical research[93–94].
5.1.3 Optimization Scheme of Population Density Models Based on
Random Forest
In countries or regions where comprehensive agricultural
zoning has been implemented, it is encouraged that comprehensive agricultural
zoning maps as well as urban and rural distribution maps be superimposed, to
form comprehensive endowment zoning plans. In those countries or regions
without comprehensive agricultural zoning, it is advised that geomorphic zoning
maps and urban and rural distribution maps are superimposed to form alternative
comprehensive endowment zoning plans. Based on the minimum granularity population
density map (Figure 3a), natural (DEM, relief, distance from natural rivers,
NDVI, annual mean temperature, annual amount of precipitation and so on),
economic (traffic accessibility, POIs kernel density combination figures), and
innovation endowment (POIs distance combination figures) datasets, one can
conduct random sampling (overcoming the ecological fallacy problem, and
circumventing MAUP) using the hectare grid as the analysis unit, to build
training sample datasets, which are then applied in random forest modeling,
enabling one to calculate population density. This is all done by zone, to
avoid confusion in the population distribution quantified and its interpretation.
A
series of population density mapping experiments should be carried out. Impact
factors acting on population density can be screened on a per zone basis, by
adding or deleting one of the factors or adjusting the sampling size,
accordingly, to define the optimal sampling size of the training sample sets so
as to avoid introducing erroneous factors. The optimal sampling size can be
defined by zone to improve the overall reliability of the model. Combined with
field investigations, qualitative and quantitative comparative analysis could
be pursued to ensure the model??s validity. Finally, via the synthesis of the
mapping experiment??s results, technological details of the optimization scheme
for the random forest-based population density models are defined (Figure 4).

Figure 4 Optimization scheme of a population density
model based on random forest method
5.2 Conclusion
In the last 30 years, with the continuous improvement of
global geographical big data and the progress of machine learning algorithms,
the gridded population density models have gradually evolved, shifting from
interposition models, such as areal weighted and distance d, to linear
regression and random forest models. The population density maps compiled with
models based on random forest have greater accuracy, but these models are still
plagued by the problems of ecological fallacy, MAUP, mixed-up population
distribution patterns, and a less than-meticulousness impact factor selection.
Minimum granularity
population density maps can be compiled by applying areal- weighted models
based on population data of villages?? residents. The grounded theory of
regional population density can be implemented by adopting filter models to
carry out scaling-up calculations. Population density??s impact factors can be
selected from the natural, economical, and innovation endowment factors. Random
sampling by zoning can be applied, using the hectare grid as the sampling unit,
to overcome the ecological fallacy problem arising from sampling unit area
exceeding the output unit area and to avoid MAUP due to the aggregation
operation of the training sample data. In this way, the quality of the training
sample data obtained from the random forest-based population density model is
greatly improved. Then a group control experiment can be conducted with that
latter model to select factors impacting population density, to explore the
sampling size, and to compile a population density map, all on a by-zone basis,
so that the confusion in population distribution patterns on population density
maps can be avoided and both the reliability and validity of the models based
on random forest is further improved. The optimization scheme of such models
will further promote the fundamental theoretical research on mechanisms influencing
population density, patterns of population distribution, and laws of population
evolution.
References
[1]
Wu, W. H.,
Niu, S. W. A comparative study on the impact of population growth and
consumption increase on China??s resource-environment [J]. Chinese Journal of Population Science, 2009, 23(2): 66‒73.
[2]
Goldewijk,
K. K., Ramankutty, N. Land cover change over the last three centuries due to
human activities: The availability of new global data sets [J]. GeoJournal, 2004, 61(4): 335‒344.
[3]
Goldewijk,
K. K., Beusen, A., Drecht, G. V., et al.
The HYDE 3.1 spatially explicit database of human-induced global land-use
change over the past 12,000 years [J]. Global
Ecology & Biogeography, 2011,
20(1): 73‒86.
[4] Leyk, S., Gaughan, A. E.,
Adamo, S. B., et al. The spatial
allocation of population: a review of large-scale gridded population data
products and their fitness for use [J]. Earth
System Science Data, 2019, 11(3): 1385‒1409.
[5]
Bai, Z. Q., Wang, J. L., Yang, F. Research progress in
spatialization of population data [J]. Progress
in Geography, 2013, 32(11): 1692–1702.
[6]
Tatem, A.
J. WorldPop, open data for spatial demography [J]. Scientific Data, 2017, 4(1): 1‒4.
[7]
Hu, H. Y. The distribution of population in China: with statistics
and maps [J]. Acta Geographica Sinica,
1935, 2(2): 33‒74.
[8]
Zhang, C. X. Using latitude and longitude grid cells to compile a
population density map: taking the Beijing-Tianjin-Tangshan area as an example
[J]. Areal Research and Development,
1985, 4(2): 57‒66.
[9]
Openshaw,
S. The Modifiable Areal Unit Problem [M]. Norwich, UK: Geobooks, 1983.
[10]
Yang, X. H., Jiang, D., Wang, N. B., et al. Method of pixelizing population data [J]. Acta Geographica Sinica, 2002, 57(0z1):
70‒75.
[11]
Liu, J. S.,
Wang, W., Xiang, H. B. The computational model of multi-scale population
density [C]. International Conference on
Geoinformatics, 2011: 1‒4.
[12]
Clarke, J.
I., Rhind, D. W., Becket, C., et al.
Population data and global environmental change [Z]. Barcelona Spain
International Social Science Council Human Dimensions of Global Environmental
Change Programme, 1992, 3(2): 147
[13]
Center for
International Earth Science Information Network (CIESIN), Columbia University.
Documentation for the gridded population of the world, version 4 (GPWv4), revision
11 data sets [EB/OL]. NASA Socioeconomic Data and Applications Center (SEDAC). https://sedac.ciesin.columbia.edu/downloads/docs/
gpw-v4/gpw-v4-documentation-rev11.pdf.
[14]
Center for
International Earth Science Information Network (CIESIN, Columbia University),
International Food Policy Research Institute (IFPRI), The World Bank, et al. Global rural-urban mapping
project, version 1: population density grid [EB/OL]. NASA Socioeconomic Data
and Applications Center (SEDAC). https://sedac.ciesin.columbia.edu/data/set/grump-v1-population-density.
[15]
Florczyk, A.
J., Corbane, C., Ehrlich, D., et al.
GHSL data package 2019 [EB/OL]. European Commission Joint Research Center. https://ghsl.jrc.ec.europa.eu/documents/GHSL_Data_Package_2019.pdf?t=
1478q532234372.
[16]
Frye, C., Wright, D. J., Nordstrand, E., et al. Using classified
and unclassified land cover data to estimate the footprint of human settlement
[J]. Data Science Journal, 2018, 17(4):
1‒12.
[17]
Goldewijk, K. K., Beusen, A., Janssen, P. Long-term dynamic
modeling of global population and built-up area in a spatially explicit way:
HYDE 3.1 [J]. The Holocene, 2010,
20(4): 565‒573.
[18]
Oak Ridge National Laboratory. LandScan datasets [EB/OL]. UT-Battelle
for the Department of Energy. https://landscan.ornl.gov/landscan-datasets.
[19]
WorldPop, University of Southampton. Population density
[EB/OL]. School of Geography and Environmental Science, University of
Southampton; Department of Geography and Geosciences, University of Louisville;
Departement de Geographie, Universite de Namur, Center for International Earth
Science Information Network (CIESIN), Columbia University. https://www.worldpop.org/project/categories?id=18.
[20]
Fu, J. Y., Jiang, D., Huang, Y. H. 1 km grid population dataset of
China (2005, 2010) [J]. Acta Geographica
Sinica, 2014, 69(s1): 41‒44.
[21]
Fu, J. Y., Jiang, D., Huang, Y. H. 1 km grid population dataset of
China [J/DB/OL]. Digital Journal of
Global Change Data Repository, 2014. https://doi.org/10.3974/geodb.2014.01.06.V1.
[22]
Smith, K.
We are seven billion [J]. Nature Climate
Change, 2011, 1(7): 331‒335.
[23]
World
Resources Institute (WRI). World resources 2010–2011: Decision making in a
changing climate — adaptation challenges and choices [J]. Executive Summary, 2011, 4(6): 305.
[24]
Gleeson, T.,
Wada, Y., Bierkens, M. F. P., et al.
Water balance of global aquifers revealed by groundwater footprint [J]. Nature, 2012, 488(7410): 197‒200.
[25]
Kibret, S.,
Lautze, J., Mccartney, M., et al.
Malaria impact of large dams in sub-Saharan Africa: Maps, estimates and
predictions [J]. Malaria Journal,
2015, 14(1): 339.
[26]
Goldewijk,
K. K. Three centuries of global population growth: a spatial referenced
population (density) database for 1700–2000 [J]. Population and Environment, 2005, 26(4): 343‒367.
[27]
Seto, K. C.,
Guneralp, B., Hutyra, R. Global forecasts of urban expansion to 2030 and direct
impacts on biodiversity and carbon pools [J]. Proceedings of the National Academy of Sciences of the United States of
America, 2012, 109(40): 16083‒16088.
[28]
Melchiorri,
M., Florczyk, A. J., Freire, S., et al.
Unveiling 25 years of planetary urbanization with remote sensing: Perspectives
from the global human settlement layer [J]. Remote
Sensing, 2018, 10(5): 768.
[29]
Sorichetta,
A., Bird, T. J., Ruktanonchai, N. W., et
al. Mapping internal connectivity through human migration in malaria
endemic countries [J]. Scientific Data,
2016, 3(1): 5‒11.
[30]
Ouma, P.
O., Maina, J., Thuranira, P. N., et al.
Access to emergency hospital care provided by the public sector in sub-Saharan
Africa in 2015: a geocoded inventory and spatial analysis [J]. The Lancet Glob Health, 2018, 6(3): 342‒350.
[31]
Thomson, D.
R., Linard, C., Vanhuysse, S., et al.
Extending data for urban health decision-making: A menu of new and potential
neighborhood-level health determinants datasets in LMICs [J]. Journal of Urban Health-bulletin of the New
York Academy of Medicine, 2019, 96(4): 514‒536.
[32]
Gaston, K.
J., Blackburn, T. M., Goldewijk, K. K. Habitat conversion and global avian
biodiversity loss [J]. Proceedings of the
Royal Society B: Biological Sciences,
2003, 270(1521): 1293‒1300.
[33]
Houweling, S.,
VanderWerf, G. R., Goldewijk, K. K., et al.
Early anthropogenic CH4 emissions and the variation of CH4 and 13CH4 over
the last millennium [J]. Global
Biogeochemical Cycles, 2008, 22(1): 1‒21.
[34]
Ellis, E. C.,
Goldewijk, K. K., Siebert, S., et al.
Anthropogenic transformation of the biomes, 1700 to 2000 [J]. Global Ecology & Biogeography Letters,
2010, 19(5): 589‒606.
[35]
Maisels, F.,
Strindberg, S., Blake, S., et al.
Devastating decline of forest elephants in Central Africa [J]. PLoS One, 2013, 8(3): 1‒17.
[36]
Bai, Z. Q.,
Wang, J. L., Wang, M. M., et al. Accuracy
assessment of multi-source gridded population distribution datasets in China
[J]. Sustainability, 2018, 10(5):
1363‒1378.
[37]
Ye, T. T.,
Zhao, N. Z., Yang, X. C., et al.
Improved population mapping for China using remotely sensed and
points-of-interest data within a random forests model [J]. Science of the Total Environment, 2019, 658: 936‒946.
[38]
Wang, F. H.,
Guldmann, J. M. Simulating urban population density with a gravity-based model
[J]. Socio-economic Planning Sciences,
1996, 30(4): 245‒256.
[39]
Lo, C. P. Modeling
the population of China using DMSP operational linescan system nighttime data
[J]. Photogrammetric Engineering & Remote Sensing, 2001, 67(9): 1037‒1047.
[40]
Feng, J. Modeling the spatial distribution of urban population
density and its evolution in Hangzhou [J]. Geographical
Research, 2002, 21(5): 635‒646.
[41]
Jiang, D., Yang, X. H., Wang, N. B., et al. Study on spatial distribution of population based on remote
sensing and GIS [J]. Advances in Earth
Science, 2002, 17 (5): 734‒738.
[42]
Liu, J. Y., Yue, T. X., Wang, A. Y., et al. Digital simulation of population density in China [J]. Acta Geographica Sinica, 2003(1): 17‒24.
[43]
Jin, J., Li, C. M., Yin, J., et
al. Investigation on the model for spatial distribution of population data
[J]. Acta Geodaetica et Cartographica
Sinica, 2003, 32(3): 278‒282.
[44]
Tian, Y. Z., Chen, S. P., Yue, T. X., et al. Simulation of Chinese population density based on land use
[J]. Acta Geographica Sinica, 2004,
59(2): 283‒292.
[45]
Yue, T. X., Wang, Y. A., Liu, J. Y., et al. Surface modeling of human population distribution in China
[J]. Ecological Modelling, 2005,
181(4): 461‒478.
[46]
Zhuo, L.,
Chen, J., Shi, P. J., et al. Modeling
population density of China in 1998 based on DMSP/OLS nighttime light image [J].
Acta Geographica Sinica, 2005, 60(2):
266‒276.
[47]
Liu, J. S.
The geographical meaning about the modifiable areal unit problem in the
population density
scaling
[D]. Shijiazhuang: Hebei Normal University, 2009.
[48]
Zeng, C. Q.,
Zhou, Y., Wang, S. X., et al.
Population spatialization in China based on night-time imagery and land use data [J].
International Journal of Remote Sensing,
2011, 32(24): 9599‒9620.
[49]
Gao, Y., Wang, H., Wang, P. T., et al. Population spatial processing for Chinese coastal zones
based on census and multiple night light data [J]. Resources Science, 2013, 35(12): 2517‒2523.
[50]
Tan, M., Liu, K., Liu, L., et
al. Spatialization of population in the Pearl River Delta in 30 m grids
using random forest model [J]. Progress
in Geography, 2017, 36(10): 1304‒1312.
[51]
Wang, C., Kan, A. K., Zeng, Y. L., et al. Population distribution pattern and influencing factors in
Tibet based on random forest model [J]. Acta
Geographica Sinica, 2019, 74(4): 664‒680.
[52]
Wardrop, N.
A., Jochem, W. C., Bird, T. J., et al.
Spatially disaggregated population estimates in the absence of national
population and housing census data [J]. Proceedings
of the National Academy of Sciences of the United States of America, 2018,
115(14): 3529‒3537.
[53]
Tobler, W.,
Deichmann, U., Gottsegen, J., et al.
World population in a grid of spherical quadrilaterals [J]. International Journal of Population
Geography, 1997, 3(3): 203‒225
[54]
Clark, C. Urban
population densities [J]. Journal of the Royal
Statistical Society, 1951, 114(4): 490‒496.
[55]
Sutton, P.
Modeling population density with night-time satellite imagery and GIS [J]. Computers Environment & Urban Systems, 1997, 21(3/4): 227‒244.
[56]
Sutton, P.,
Roberts, D., Elvidge, C., et al. A
comparison of nighttime satellite imagery and population density for the
Continental United States [J]. Photogrammetric
Engineering and Remote Sensing, 1997, 63(11): 1303‒1313.
[57]
Dobson, J.
E., Bright, E. A., Coleman, P. R., et al.
LandScan: a global population database for estimating populations at risk [J]. Photogrammetric Engineering and Remote
Sensing, 2000, 66(7): 849‒857.
[58]
Amaral, S.,
Monteiro, A. M. V., Câmara, G., et al.
DMSP/OLS night-time light imagery for urban population estimates in the
Brazilian Amazon [J]. International
Journal of Remote Sensing, 2006, 27(5): 855‒870.
[59]
Bhaduri, B.,
Bright. E., Coleman, P., et al. LandScan
USA: a high-resolution geospatial and temporal modeling approach for population
distribution and dynamics [J]. GeoJournal,
2007, 69(1/2): 103‒117.
[60]
Briggs, D.
J., Gulliver, J., Fecht, D., et al.
Dasymetric modelling of small-area population distribution using land cover and
light emissions data [J]. Remote Sensing
of Environment, 2007, 108(4): 451‒466.
[61]
Stevens, F.
R., Gaughan, A. E., Linard, C., et al.
Disaggregating census data for population mapping using random forests with
remotely-sensed and ancillary data [J]. PLoS
One, 2015, 10(2): 1‒22.
[62]
Gaughan, A.
E., Stevens, F. R., Huang, Z., et al.
Spatiotemporal patterns of population in mainland China, 1990 to 2010 [J]. Scientific Data, 2016, 3(1): 1‒11.
[63]
Yang, X. C.,
Yue, W. Z., Gao, D. W. Spatial improvement of human population distribution
based on multi-sensor remote-sensing data: an input for exposure assessment [J].
International Journal of Remote Sensing,
2013, 34(15): 5569‒5583.
[64]
Breiman, L.
Random forests [J]. Machine Learning,
2001, 45(1): 5‒32.
[65]
Bakillah,
M., Liang, S., Mobasheri, A., et al.
Fine-resolution population mapping using OpenStreetMap points-of-interest [J]. International Journal of Geographical
Information Science, 2014, 28(9): 1940‒1963.
[66]
Hay, S. I.,
Noor, A. M., Nelson, A., et al. The
accuracy of human population maps for public health application [J]. Tropical Medicine & International Health, 2005, 10(10):
1073‒1086.
[67]
Balk, D.
L., Deichmann, U., Yetman, G., et al.
Determining global population distribution: methods, applications and data [J].
Advances in Parasitology, 2006,
7(62): 119‒156.
[68]
Mondal, P.,
Tatem, A. J. Uncertainties in measuring populations potentially impacted by sea
level rise and coastal flooding [J]. PLoS
One, 2012, 7(10): 1‒7.
[69]
Smith, A.,
Bates, P. D., Wing, O., et al. New
estimates of flood exposure in developing countries using high-resolution
population data [J]. Nature
Communications, 2019, 10(1): 1‒7.
[70]
Wang, Y.
Study of population density based on random forest model [D]. Shijiazhuang:
Hebei Normal University, 2020.
[71]
Hu, H. Y. The distribution, regionalization and prospect of
China??s population [J]. Acta Geographica
Sinica, 1990, 45(2): 139‒145.
[72]
Hu, H. Y. The Past and Future of Population Growth and Economic
Development in the Eight Regions of China [M]. Shanghai: East China Normal
University Press, 1986.
[73]
Hu, H. Y. Population, Economy and Ecological Environment in the
Three Belts of Eastern, Central and Western China [M]. Shanghai: East China
Normal University Press, 1989.
[74]
Wu, C. J. The core of study of geography: man-land relationship
areal system [J]. Economic Geography,
1991, 11(3): 1–6.
[75]
Fan, J. Comprehensiveness of geography and integrated research on
regional development [J]. Acta Geographica
Sinica, 2004, 59(S1): 33‒40.
[76]
Fan, J. Academic thinking and economic geography of the ??regional
system of man-land relationship?? [J]. Economic
Geography, 2008, 28(2): 870‒878.
[77]
Fan, J. The progress and characteristics of Chinese human
geography over the past 70 years [J]. Scientia
Sinica Terrae, 2019, 49(11): 1697–1719.
[78]
Krugman, P. First nature, second nature, and metropolitan location
[J]. Journal of Regional Science,
1993, 33(2): 129‒144.
[79]
Lu, D. D. New factors and new patterns of regional development in
China [J]. Geographical Research,
2003, 22(3): 261‒271.
[80]
Xia, H. B., Wang, Z. Evolution of land differentiation in Chinese
mainland [J]. Geographical Research,
2012, 31(12): 2123‒2138.
[81]
Zheng, D., Ou, Y., Zhou, C. H. Understanding of and thinking over
geographical regionalization methodology [J]. Acta Geographica Sinica, 2008, 6(3): 563‒573.
[82]
Editing Group of Collections of Huang Bingwei. Integrated Studies
of Geography: Collections of Huang Bingwei [M]. Beijing: The Commercial Press,
2003.
[83]
Liu, C. M., Zheng, D., Lu, D. D., et al. Development orientations for geographical sciences: written
speeches by editors in Chief from Geographical Journals [J]. Acta Geographica Sinica, 2005, 60(4):
531‒545.
[84] Hu,
H. Y. Essays on China??s Population Distribution [M]. Shanghai: East China
Normal University Press, 1983.
[85]
Ding, J. H., Liu, Z. Y., Cheng, D. M., et al. Areal differentiation of inter-provincial migration in China
and characteristics of the flow field [J]. Acta
Geographica Sinica, 2005, 60(1): 106‒114.
[86]
Ge, M. L., Feng, Z. M. Research on the distribution pattern of
China??s population in 2000 Based on GIS: compared with Hu Huanyong??s research
in 1935 [J]. Population Research,
2008, 32(1): 51‒57.
[87]
Liu, S. H., Deng, Y., Hu, Z. Research on classification methods
and spatial patterns of the regional types of China??s floating population [J]. Acta Geographica Sinica, 2010, 65(10):
1187‒1197.
[88]
Qi, W., Liu, S. H., Zhao, M. F. Study on the stability of Hu Line
and different spatial patterns of population growth on its both sides [J]. Acta Geographica Sinica, 2015, 70(4):
551‒566.
[89]
Lu, D. D., Wang, Z., Feng, Z. M., et al. Academic debates on Hu Huanyong population line [J]. Geographical Research, 2016, 35(5):
805‒824.
[90]
Chen, M. X., Li, Y., Gong, Y. H., et al. The population distribution and trend of urbanization pattern
on two sides of Hu Huanyong population line: a tentative response to Premier Li
Keqiang [J]. Acta Geographica Sinica,
2016, 71(2): 179‒193.
[91]
Zhou, L. S. The Theory and Practice of Agricultural
Regionalization in China [M]. Hefei: University of Science and Technology of
China Press, 1993.
[92]
Liu, Y. S, Zhang, Z. W., Wang, J. Y. Regional differentiation and
comprehensive regionalization scheme of modern agriculture in China [J]. Acta Geographica Sinica, 2018, 73(2):
203‒218.
[93]
Song, C. Q. On paradigms of geographical research [J]. Progress in Geography, 2016, 35(1): 1‒3.
[94]
Song, C. Q., Cheng, C. X., Shi, P. J. Geography complexity: New
connotations of geography in the new era [J]. Acta Geographica Sinica, 2018, 73(7): 1204–1213.