Google Earth Images Based Land Cover Data Validation Dataset for GlobeLand30 (2010) in the Region of Roof of the World
Wang, Z. X.1* Liu, C.1 Tun, W. N.2
1. State Key Laboratory of Resources and Environmental Information System, Institute of Geographic Sciences and Natural Resources Research, Chinese Academy of Sciences, Beijing 100101, China;
2. Resource and Environment Myanmar Co., Ltd., Yangon 11201, Myanmar
Abstract: GlobeLand30 (2010) is the first 30 m spatial resolution global land cover dataset, which was produced by Chinese institutes led by National Geomatics Center of China. The global validation of GlobeLand30 (2010) was initiated by GEO in 2016 and served two purposes at least: an informative application of GlobeLand30 (2010) for users; and more efficient update of GlobeLand30 (2010) for producers. The validation in the region of Roof of the World (ROTW) is part of this global effort. Using Landscape Index Based (LSI) sampling method, 801 samples (plots) were extracted for ROTW, including: 24 plots for cultivated land, 127 plots for forestry, 331 plots for grass lands, 116 plots for shrub lands, 2 plots for wetland, 10 plots for water body, 1 plots for artificial land surfaces, 171 plots for bare land, and 19 plots for permanent snow and ice. Three steps were taken to label samples: (1) conversion of sample from point to 30 m x 30 m square; (2) conversion of shapefile to Google Earth format (.kmz); (3) labeling samples based on time serial Google Earth images. There is six major ‘Fields’ in validation sample dataset files: the first three from Sampling period–SID, LCType, and LCName; the second three from Labeling period – CONF (confidence of labeling: 1 for good, sure for only one class, Class_1; 2 for fair, sure for one of two classes, Class_1 or Class_2; 3 for poorest), Class_1 (primary class), and Class_2 (secondary class, if CONF=2). The labeling results indicate that 725 out of 801 (91.51%) samples can be classified with confidence ‘good’ and ‘fair’ and can be used for accuracy assessment of GlobeLand30 (2010). The overall accuracy of GlobeLand30 (2010) ranges from 71.72% (if only Class_1 is used) to 83.86% (if both Class_1 and Class_2 are used). The dataset is archived in both .shp and .kmz data formats with the data size of 550 KB (Compressed to 141 KB in three data files).
Keywords: land cover; GlobeLand30 (2010); Roof of the World; validation sample; accuracy assessment; Google Earth
1 Introduction
In order to assist scientific research and decision-making at the global scale, since the beginning of 1990s, the international land cover community has developed four sets of global 1 km land cover products. Each of these products used similar input data followed unified classification system and classification methods to a certain extent, to solve the problem of inconsistency on the national scale. But the 1 km resolution of these products is much larger than the scale (±30 m) directly affected by the main human activities. Because some “class” is actually “mixtures of multiple classes”, the accuracy of land cover products is difficult to verify, and some of the changes detected are difficult to decipher. Since the accuracy of these four global 1 km land cover databases is only 66.9%–78.3%, their applications have been seriously hindered[1–5]. In the mid-late 2000’s, ESA increased the spatial resolution of the global land cover database from 1 km to 300 m, but its classification accuracy is still only 67.5%–73.1%, which is still far from the actual demand[6–8].
After USGS freely opened global Landsat data in 2008 [9], the spatial resolution of global land cover products jumped from 300 m to 30 m. In addition to the single-class global 30 m dataset such as forest [10], the more important is the global land cover database of all types, including the 30 m Global Land Cover Database (GlobeLand30), part of its validation will be discussed in this paper. GlobeLand30 database is developed by China National Basic Geographic Information Center. It uses 30 m resolution remote sensing data as the main data source, uses 10 types of land cover classification systems worldwide, and uses a three-tiered algorithm (Pixel-Object-Knowledge, POK) to refine classification step by step[11–12]. The representative time of the database is 2000 and 2010. After its finish in 2014, the Chinese government donated GlobeLand30 to the United Nations for free global sharing [13], and received applications and research from global users[14–15].
As the first global land cover product of 30 m scale, GlobeLand30 inevitably has unexpected problems despite improvements in methods. In fact, there are always doubts about the reliability of land cover products[16]. In order to further improve the products, the China Basic Geographic Information Center initiated third-party global validation in 2014, and conducted several validation training and technical exchanges workshops between 2015 and 2016. The validation is organized by recruiting interested members from GEO to complete the validation work in familiar areas. The scheme of verification technology can be divided into two levels: one is “Global Accuracy Assessment” and the other is “Regional Accuracy Assessment”. The latter is composed of four regions, of which the “Roof of the World” is one.
Validation (verification) should have been an integral part of land cover development, but data quality is hardly taken into account in the era of data scarcity. With the emergence of various land cover data, higher requirements are put forward for data quality, which also includes the quality of validation data. In order to promote the wider application of validation data, the validation dataset discussed in the present paper has been published[17]. This paper introduces the method of validation data development, and focuses on two issues: (1) to what extent can the historical image of Google Earth as the main reference data satisfy the validation requirements of GlobeLand30 (2010) in the scarcely populated area of the world's roof; (2) To evaluate the accuracy of GlobeLand30 (2010) based on the qualified validation data.
2 Metadata of Dataset
The metadata of the dataset[17] is shown in Table 1.
Table1 Metadata summary of “Google Earth images based land cover data validation dataset for GlobeLand30 (2010) in the region of Roof of the World”
|
Items
|
Description
|
|
Dataset full name
|
Google Earth images based land cover data validation dataset for GlobeLand30 (2010) in the region of Roof of the World
|
|
Dataset short name
|
Sample_LSI_ROTW
|
|
Authors
|
Wang, Z. X. L-5255-2016, Institute of Geographic Sciences and Natural Resources Research, Chinese Academy of Sciences, wangzx@igsnrr.ac.cn
Liu, C. L-3684-2016, Institute of Geographic Sciences and Natural Resources Research, Chinese Academy of Sciences, lchuang@igsnrr.ac.cn
|
|
Geographical region
|
The region of the Roof of the world (61°29¢27.44″E–105°43¢28.33″E, 23°11¢59.47″N– 40°1¢8.67″N)
|
|
Date
|
2010 Spatial resolution 30 m
|
|
Data format
|
.shp, .kmz
|
|
Data volume
|
550 KB (141 KB after compression)
|
|
Data files
|
Geo-location and interpretation of samples, one content in three formats:
(1) Sample_LSI_ROTW_Point.kmz: sample (point)
(2) Sample_LSI_ROTW_Square.kmz: sample (30 m×30 m, polygon)
(3) ValPlotROTWGlobeLand30(2010).rar: compressed file of (1) and (2)
|
|
Foundation
|
Ministry of Science and Technology of P. R. China (2016YFA0600201)
|
|
Data publisher
|
Global Change Research Data Publishing and Repository, http://www.geodoi.ac.cn.
|
|
Address
|
No. 11A, Datun Road, Chaoyang District, Beijing 100101, China
|
|
Data sharing policy
|
Data from the Global Change Research Data Publishing & Repository includes metadata, datasets (data products), and publications (in this case, in the Journal of Global Change Data & Discovery). Data sharing policy includes: (1) Data are openly available and can be free downloaded via the Internet; (2) End users are encouraged to use Data subject to citation; (3) Users, who are by definition also value-added service providers, are welcome to redistribute Data subject to written permission from the GCdataPR Editorial Office and the issuance of a Data redistribution license, and; (4) If Data are used to compile new datasets, the ‘ten per cent principal’ should be followed such that Data records utilized should not surpass 10% of the new dataset contents, while sources should be clearly noted in suitable places in the new dataset[18]
|
|
Communication and searchable system
|
DOI, DCI, CSCD, WDS/ISC, GEOSS, China GEOSS
|
3 Methods
The accuracy evaluation of land cover includes three parts[19]: sampling design, sample interpretation, and accuracy evaluation. Among them, the sampling design is completed by the validation project, and the actual sampling for specific region needs to select the confidence level according to the complexity of this region to determine the number of sampling. Therefore, this paper focuses on sample interpretation and accuracy evaluation.
3.1 Sampling Design
The Roof of the World (RoTW) is a plateau mountainous area with the Qinghai-Tibet Plateau as its core. According to the literature[20], RoTW has an area of 4,000,947 km2, of which 53.75% is over 4,000 m. This vast scope and huge relative elevation lead to the diversity of land cover types, and provide a broad representation for the global validation of GlobeLand30.
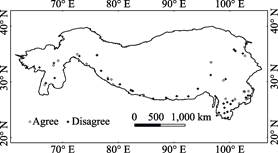
The sampling adopts a Landscape-Shape-Index-based method[21] recommended by the project, and the specific operation is completed on the project platform[22]. Considering the complexity of this region, 95% confidence level was selected for sampling. At this level, 801 validation points are extracted (Figure 1, Table 2). Figure 1 shows that the sampling density is relatively small in the vast area above the plateau, while in the southern fringe area, the ground heterogeneity is strong and the sampling density is high.
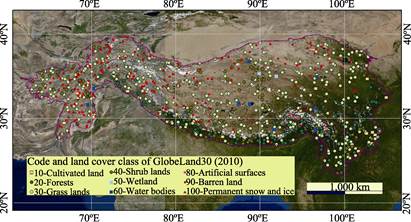
Figure 1 Sampling result in the region of Roof of the World
|
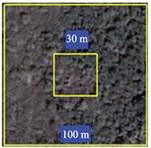
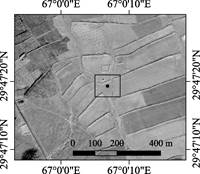
Figure 2 Interpretation unit
|
Table 2 Sample types in GlobeLand30
|
LCType
|
Land cover class
|
Samples
|
|
10
|
Cultivated land
|
24
|
|
20
|
Forest
|
127
|
|
30
|
Grassland
|
331
|
|
40
|
Shrub land
|
116
|
|
50
|
Wetland
|
2
|
|
60
|
Water bodies
|
10
|
|
80
|
Artificial surfaces
|
1
|
|
90
|
Barren land
|
171
|
|
100
|
Permanent snow and ice
|
19
|
|
Total
|
|
801
|
|
3.2 Sample Interpretation
Sample interpretation is the process to give each sample a class name according to the classification system definition and reference data.
3.2.1 Interpretation Unit
From sampling algorithm[21], each sample “point” actually represents a 30 m by 30 m pixel. Sample interpretation needs to zoom in and zoom out the reference data (Google Earth Image), so the boundary of the basic interpretation unit should be clearly defined: it is a 30 m by 30 m square centered on this sample point (Figure 2). However, in order to better interpret the basic unit, one needs to refer to information in larger space. The actual meaning of “basic interpretation unit” and “sample” in this paper is the same.
3.2.2 Reference Data
Since the reliable interpretation of permanent snow and ice can only be achieved with information from the hottest months, the reference data used in this paper are mainly historical Google Earth imagery. Although the validation date is year 2010, we can use the knowledge of geosciences to use more reference data.
3.2.3 The Uniqueness of Sample Interpretation in the Roof of the World Region
Generally, ten elements can be used to aid the sample interpretation (Table 3), of which the first seven are commonly used in early stage of remote sensing interpretation[23], and the last three are new elements added to Google Earth images. Specifically, the sample interpretation in RoTW has the following characteristics.
Vegetation in true color images: Unlike most parts of the world, the main characteristics of this area are low temperature, short growing season, more clouds and fog in the short growing season, and less high-quality satellite images. This leads to vegetation not typically green in the reference data. The interpretation of vegetation depends more on texture, shape, shadow and other elements.
Table 3 Ten elements to facilitate Google Earth based reference data interpretation
|
Elements
|
Characteristics
|
|
Shape
|
The general form, configuration, or outline of individual objects
|
|
Size
|
The size of objects within a pixel can be estimated by reference of a 30 m by 30 m square
|
|
Pattern
|
Spatial arrangement of objects
|
|
Shadow
|
Shadows may be from cloud, relief, or plants; it can help or hamper sample interpretation
|
|
Tone
|
The color or relative brightness of objects on the objects on imageries
|
|
Texture
|
The internal structure of an object
|
|
Site
|
The location of an object
|
|
Temporal
|
Seasonal or annual change of an object
|
|
Spatial
|
The relative characteristic of an object in a broader transitional region
|
|
Altitude
|
Some land covers depend heavily on altitude??tree line, snow line
|
Temporal information: Reference data from multiple seasons are helpful for all sample interpretation, and is indispensable for interpreting permanent snow and ice samples. A sample can only be regarded as “permanent snow and ice” if it is still covered with snow/ice during summer.
Spatial information: As with temporal information, a sample may be better interpreted in a spatial context. Sometimes, it is hard to give a sample a class only looking at local information, yet putting this sample in a broader space (typically, a vertical or horizontal zone), it becomes easier, from this wider spectrum, to determine this sample belongs to a “typical class”, or mere a “transitional class”.
3.2.4 Interpretation Confidence and Sample Quality
Interpretation confidence refers to the interpreter’s judgment on the reliability of a sample interpretation. Low interpretation confidence may be objective (poor reference data) or subjective (interpreters have little knowledge of the region). Interpretation confidence can be divided into three categories, and sample interpretations with various confidences will be applied accordingly in later stages.
High-quality sample: It can be determined with high confidence that the sample in question only belongs to one land cover. High-quality sample points satisfy four characteristics: qualified time; high spatial resolution; clear-looking image; only one dominant class.
Medium-quality sample: It can be determined with confidence that the sample in question only belongs to one of two land covers. For example, the sample is located in a transitional spot of a natural zone, or a mixture of two dominant land covers.
Low-quality sample: It is hard to assign a land cover class to a sample, either due to poor reference data, or due to interpreter’s want of knowledge about this region.
Application of interpretation confidence: All low-quality samples will be dismissed and not participate in accuracy evaluation; all high-quality samples will participate in accuracy evaluation; and medium-quality samples will participate in accuracy evaluation, but the selection of two types determines the range of accuracy assessment.
4 Results
4.1 Quality of Samples
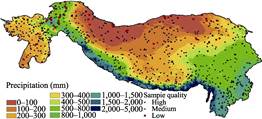
Based on aforementioned criteria, all 801 samples follow into three quality levels: High quality (479, 59.80%); medium quality (246, 30.71%); and low quality (76, 9.49%) (Figure 3). The samples in first two levels (725, 91.51%) are qualified to GlobeLand30 accuracy assessment, the samples in third level will be discarded for accuracy evaluation.
4.2 GlobeLand30 (2010) Accuracy Assessment Based on Qualified Samples
It is worth noting that medium-quality samples may be categorized into two classes: primary class, or secondary class. Accordingly, there are to results for accuracy assessment.
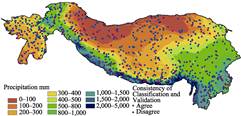
(1) The lowest accuracy (at least). If only “Primary class (Class=1)” is considered, we got an error matrix (Table 4), and a consistency of GlobeLand30 (2010) classification and validation (Figure 4). Based on this criteria, the overall accuracy (OA) = 71.72%, with a Kappa of 0.62. Since we ignored the “Secondary Class (Class=2)”, we think the classification accuracy of GlobeLand30 (2010) in this region is above 71.72%. Specifically, for cropland (code=10), its producer’s accuracy is only 37.04%, with its user’s accuracy as high as 86.96%, indicating a grave omission problem.
|
|
|
|
Figure 3 Quality of samples with annual rainfall as background
|
Figure 4 Consistency of Globeland30(2010) classification and validation
|
|
(2) The highest accuracy (at most). If both “Primary class (Class=1)” and Secondary Class (Class=2)” are considered, we got an error matrix (Table 5). Based on this criteria, the overall accuracy (OA) = 83.86%, with a Kappa of 0.78. Since we lowered the validation bar in this case, we think the classification accuracy of GlobeLand30 (2010) in this region is below 83.86%. Specifically, for cropland, its producer’s accuracy is only 43.75%, with its user’s accuracy of 91.3%, indicating a grave omission problem.
5 Discussion
(1) Major Classification Errors of GlobeLand30 (2010) in the Roof of the World’s Region. From Tables 2, Table 4 and Table 5, 23 of the 24 “Cultivated land (LCType = 10)” samples are valid samples. Among them, 20 (Table 4) and 21 (Table 5) have been confirmed by interpretation based on reference data, with high user’s accuracy (86.96%–91.30%). However, according to the interpretation of reference data, “Cultivated land” is prone to be misclassified as “Grassland” (LCType=30). In Table 4, of 54 “Cultivated land” (LCType=10) samples, 17 were misclassified as “Grassland” (LCType=30); in Table 5, of 48 “Cultivated land” (LCType=10) samples, 14 were misclassified as “Grassland” (LCType=30).
(2) Spatial patterns of Cultivated land misclassification. Figure 5 shows the interpretation consistency of Cultivated land samples. Constrained by low temperature of high altitude, Cultivated land are mainly distributed in the south and east. Most of the Cultivated land misclassifications are located in the southeastern part of the region, where the fragmented terrains lead to mixture of small plots of Cultivated land and grassland. Other Cultivated land misclassifications are scattered, including large scale Cultivated land in the southwest that were misclassified as grasslands (Figure 6).
(3) Recommendations for classification refinement: the validation suggests that omission of Cultivated land is one of the serious problems of misclassification in the Roof of the World. Therefore, the future update of GlobeLand30 (2010) should refine its classification method at least in two aspects: to recognize Cultivated land in highly heterogeneous regions; to differentiate Cultivated land from grassland and barren land in arid regions.
Table 4 The error matrix of GlobeLand30 (2010) validation in the Roof of the World (at least)
|
|
|
Reference dataset; Confidence=1 or 2; Class=1 (Primary)
|
Sum
|
User’s accuracy (%)
|
|
|
LCType
|
10
|
20
|
30
|
40
|
50
|
60
|
70
|
80
|
90
|
100
|
|
Product: GlobeLand30
|
10
|
20
|
1
|
0
|
1
|
0
|
0
|
0
|
1
|
0
|
0
|
23
|
86.96
|
|
20
|
6
|
88
|
14
|
13
|
0
|
0
|
0
|
0
|
2
|
0
|
123
|
71.54
|
|
30
|
17
|
11
|
226
|
26
|
0
|
1
|
0
|
0
|
14
|
5
|
300
|
75.33
|
|
40
|
6
|
5
|
23
|
70
|
0
|
1
|
0
|
0
|
0
|
0
|
105
|
66.67
|
|
50
|
0
|
0
|
1
|
0
|
1
|
0
|
0
|
0
|
0
|
0
|
2
|
50
|
|
60
|
1
|
0
|
0
|
0
|
0
|
8
|
0
|
0
|
0
|
0
|
9
|
88.89
|
|
70
|
0
|
0
|
0
|
0
|
0
|
0
|
0
|
0
|
0
|
0
|
0
|
–
|
|
80
|
0
|
0
|
0
|
0
|
0
|
0
|
0
|
1
|
0
|
0
|
1
|
100
|
|
90
|
4
|
1
|
43
|
2
|
0
|
0
|
0
|
0
|
91
|
2
|
143
|
63.64
|
|
100
|
0
|
0
|
0
|
2
|
0
|
0
|
0
|
0
|
2
|
15
|
19
|
78.95
|
|
|
Sum
|
54
|
106
|
307
|
114
|
1
|
10
|
0
|
2
|
109
|
22
|
520
|
|
|
|
Producer’s accuracy (%)
|
37.04
|
83.02
|
73.62
|
61.40
|
100
|
80
|
–
|
50
|
83.49
|
68.18
|
|
725
|
|
Pa=Overall accuracy=520/725=71.72%; Kappa = (Pa–Pe)/(1–Pe)=0.620,1
|
Table 5 The error matrix of GlobeLand30 (2010) validation in the Roof of the World (at most)
|
|
|
Reference dataset; Confidence=1 or 2; Class=1 (Primary) or 2 (Secondary)
|
Sum
|
User’s accuracy (%)
|
|
|
LCType
|
10
|
20
|
30
|
40
|
50
|
60
|
70
|
80
|
90
|
100
|
|
Product: GlobeLand30
|
10
|
21
|
1
|
0
|
1
|
0
|
0
|
0
|
0
|
0
|
0
|
23
|
91.30
|
|
20
|
5
|
98
|
14
|
4
|
0
|
0
|
0
|
0
|
2
|
0
|
123
|
79.67
|
|
30
|
14
|
10
|
266
|
4
|
0
|
0
|
0
|
0
|
2
|
4
|
300
|
88.67
|
|
40
|
4
|
2
|
9
|
90
|
0
|
0
|
0
|
0
|
0
|
0
|
105
|
85.71
|
|
50
|
0
|
0
|
1
|
0
|
1
|
0
|
0
|
0
|
0
|
0
|
2
|
50
|
|
60
|
0
|
0
|
0
|
0
|
0
|
9
|
0
|
0
|
0
|
0
|
9
|
100
|
|
70
|
0
|
0
|
0
|
0
|
0
|
0
|
0
|
0
|
0
|
0
|
0
|
–
|
|
80
|
0
|
0
|
0
|
0
|
0
|
0
|
0
|
1
|
0
|
0
|
1
|
100
|
|
90
|
4
|
1
|
31
|
2
|
0
|
0
|
0
|
0
|
105
|
0
|
143
|
73.43
|
|
100
|
0
|
0
|
0
|
2
|
0
|
0
|
0
|
0
|
0
|
17
|
19
|
89.47
|
|
|
Sum
|
48
|
112
|
321
|
103
|
1
|
9
|
0
|
1
|
109
|
21
|
608
|
|
|
|
Producer’s accuracy (%)
|
43.75
|
87.50
|
82.87
|
87.38
|
100
|
100
|
–
|
100
|
96.33
|
80.95
|
|
725
|
|
Pa=Overall accuracy=608/725= 83.86 %, Kappa = (Pa–Pe)/(1–Pe)=0.781,1
|
|
|
|
|
Figure 5 Consistency of cultivated land validation
|
Figure 6 Cultivated land in arid region
|
6 Conclusion
When only Google Earth images are used as reference data, 90.51% of samples are valid for the Globeland 30 (2010) classification accuracy evaluation in the Roof of the World region. More reference data may be considered to ensure consistency with statistical assumptions in sampling design. The validation based on qualified samples show that the overall accuracy of Globeland 30 (2010) classification is between 71.72% and 83.86%, and Kappa is between 0.62 and 0.78. The key to improve the classification accuracy in the future is in cultivated land, including the classification of large area cultivated land in the arid west and the mosaic of small cultivated land and grassland in the fragmented southeast.
Author contributions
Wang, Z. X. designed the development of validation datasets and wrote the manuscript of the data paper; Liu, C. provided the boundary data of the research area and revised the manuscript; Tun, W. N. interpreted the samples in Myanmar regions.
Acknowledgements
We thank Professor Chen, Jun of China National Geographic Information Center for providing GlobeLand30 (2010) dataset and validation trainings. Thanks to Dr. Han, Gang for his guidance on using GlobeLand30 platform.
References
[1] Belward, A. S., Estes J. E., Kline K. D. The IGBP-DIS global 1-km land-cover data set DISCover: a project overview [J]. Photogrammetric Engineering & Remote Sensing, 1999, 65(9): 1013–1020.
[2] Scepan, J. Thematic validation of high-resolution global land-cover data sets [J]. Photogrammetric engineering and remote sensing, 1999, 65(9): 1051–1060.
[3] McCallum, I., Obersteiner, M., Nilsson, S., et al. A spatial comparison of four satellite derived 1 km global land cover datasets [J]. International Journal of Applied Earth Observation and Geoinformation, 2006, 8:246–255.
[4] Herold, M., Mayaux, P., Woodcock, C. E., et al. Some challenges in global land cover mapping: an assessment of agreement and accuracy in existing 1 km datasets [J]. Remote Sensing of Environment, 2008, 112(5): 2538–2556.
[5] Wu, W. B., Yang, P., Zhang, L., et al. Accuracy assessment of four global land cover datasets in China [J]. Transactions of the CSAE, 2009, 25(12): 167–173.
[6] ESA, European Space Agency. GlobCover products description and validation report [OL]. ftp://uranus.esrin.esa.int/pub/globcover_v2/global/GLOBCOVER_Products_Description_Validation_Report_ I2.1.pdf. 2008.
[7] ESA, European Space Agency. GlobCover 2009 products description and validation report [OL]. ftp://due.esrin.esa.int/globcover/LandCover2009/GlobCover2009_Validation_Report_2.2.pdf. 2011.
[8] Bontemps, S., Defourny, P., Bogaert, E. V., et al. GlobCover 2009—Products description and validation report [R]. 2011.
[9] Wulder, M. A., White, J. C., Goward, S. N., et al. Landsat continuity: issues and opportunities for land cover monitoring [J]. Remote Sensing of Environment, 2008,112(3): 955–969.
[10] Hansen, M. C., Potapov, P. V., Moore, R., et al. High-resolution global maps of 21st-century forest cover change [J]. Science, 2014, 342(6187): 850–853.
[11] Chen, J., Chen, J., Liao, A. P., et al. Concepts and key techniques for 30m global land cover mapping [J]. Acta Geodaetica et Cartographica Sinica, 2014(6): 551–557.
[12] Chen, J., Chen, J., Liao, A., et al. Global land cover mapping at 30 m resolution: a POK-based operational approach [J]. ISPRS Journal of Photogrammetry & Remote Sensing, 2015, 103: 7–27. DOI: 10.1016/j.isp rsjprs.2014.09.002.
[13] Chen, J., Ban, Y., Li, S. China: open access to Earth land-cover map [J]. Nature, 2014, 514(7523): 434.
[14] Mcroberts, R. E. Satellite image-based maps: scientific inference or pretty pictures? [J]. Remote Sensing of Environment, 2011, 115(2): 715–724.
[15] Chen, J., Cao, X., Peng, S., et al. Analysis and applications of globeLand30: a review [J]. ISPRS International Journal of Geo-Information, 2017, 6(8): 230. DOI: 10.3390/ijgi6080230.
[16] Hu, J. J., Chen, J., Peng, S. Hot-spot analysis of GlobeLand30 data studying [J]. Remote Sensing Information, 2018, 33(4): 1–7.
[17] Wang, Z. X., Liu, C. Google Earth images based land cover data validation dataset for GlobeLand30 (2010) in the region of Roof of the World [DB/OL]. Global Change Research Data Publishing & Repository, 2018. DOI: 10.3974/geodb.2018.02.05.V1.
[18] GCdataPR Editorial Office. GCdataPR data sharing policy [OL]. DOI: 10.3974/dp.policy.2014.05 (Updated 2017).
[19] Olofsson, P., Foody, G. M., Herold, M., et al. Good practices for estimating area and assessing accuracy of land change [J]. Remote Sensing of Environment, 2014, 148(5): 42–57.
[20] Liu, C., Shi, R. X., Chen, W. B. Eco-regional boundary data of the Roof of the World [DB/OL]. Global Change Research Data Publishing & Repository, 2014. DOI: 10.3974/geodb.2014.01.01.V1.
[21] Chen, F., Chen, J., Wu, H., et al. A landscape shape index-based sampling approach for land cover accuracy assessment [J]. Science China Earth Sciences, 2016, 59(12): 2263–2274. DOI: 10.1007/s11430-015-5280-5.
[22] GlobeLand30 validation website [OL]. http://glcval.geo-compass.com/.
[23] Lillesand, T. M., Kiefer, R. W. Remote Sensing and Image Interpretation [M]. New York: John Wiley & Sons., 1979.