A 1 km/5 day Fractional Vegetation Cover Dataset over China-ASEAN (2013)
Mu, X. H.1 Liu Q. H.2* Ruan, G. Y.1 Zhao, J.2 Zhong, B.2 Wu, S. L.2 Peng, J. J.2
1. The State Key Laboratory of Remote Sensing Science, School of Geography, Beijing Normal University, Beijing 100875, China??
2. The State Key Laboratory of Remote Sensing Science, Institute of Remote Sensing and Digital Earth, Chinese Academy of Sciences, Beijing 100101, China
Abstract: Fractional Vegetation Cover (FVC) is an important parameter that describes the earth’s surface vegetation cover, and it is also one of the important indicators of ecosystem change. An FVC dataset with a temporal sampling interval of five days and a spatial resolution of 1 km was generated using the dimidiate pixel model. The basic data were the 1 km/5 day Normalized Difference Vegetation Index (NDVI) dataset provided by the Multi-source Data Synergized Quantitative Remote Sensing Production System (MuSyQ) and NDVI-to-FVC transformation coefficients for different climate types, land cover, and vegetation types. Inter-comparison with another FVC (i.e., GEOV1 FCOVER) showed that the FVC dataset of MuSyQ exhibits superior performance in terms of spatial and temporal continuity. Direct validation using ground FVC data from the Heihe River Basin indicated a good consistency between the FVC dataset and field measurements. The dataset is a sinusoidal tile gridded FVC product and is stored in GeoTIFF format. The China-ASEAN region is divided into 40 tiles, and each tile corresponds to a spatial coverage of 10° × 10°. The dataset is distributed in ten zip archives with a data size of 2.4 GB.
Keywords: China-ASEAN region; fractional vegetation cover; NDVI; Dimidiate Pixel Model
1 Introduction
Fractional Vegetation Cover (FVC) is defined as the percentage of the vertically projected vegetation area (including leaves, stalks, and branches) on the ground relative to the total study area[1]. It is an important parameter for describing the Earth’s surface vegetation cover, and is also one of the important indicators of ecosystem change[2]. Remote sensing is the only way to estimate FVC on a large scale[2–4]. Observations from a single satellite cannot provide sufficient data to determine FVC, due to the limitations of weather conditions and sensors. This not only restricts the precision of FVC datasets, but also leads to spatial and temporal discontinuities in the data. With the development of satellite networks, the synergy between multiple remote-sensing data sources provides an effective way to improve the quality of FVC datasets. Using the FVC production algorithm developed based on multiple sensor observations, the temporal resolution and time span of the datasets can be improved to better service the application of remote-sensing products.
The dataset described here, i.e., the 1 km spatial resolution FVC dataset for China- ASEAN[5], is an important output from China-ASEAN regional environmental remote- sensing and monitoring data. It will also serve as an important data source to evaluate the environment in this region. In this paper, detailed information and basic principles of the dataset are provided and its reliability is also evaluated.
2 Metadata of Dataset
The descriptions of the China-ASEAN FVC dataset are recorded here. The information includes the full dataset name, short dataset name, corresponding author, other authors, geographical region of the dataset content, dataset creation year, dataset spatial and temporal resolution, dataset format and size, data publisher, data sharing platform and contact information, foundation, and the data sharing policy. Table 1 summarizes the main metadata elements of the China-ASEAN FVC dataset.
3 Algorithms
Based on the study of the conversion from remotely sensed optical signals to vegetation biophysical parameters, a method for converting NDVIs to FVCs was developed [5,6]. The algorithm combines the advantages of the high levels of temporal information from coarse-resolution remotely sensed data and the high levels of spatial information from fine-resolution remotely sensed data. The FVCs were estimated using the dimidiate pixel model, and the data of MuSyQ NDVI and the NDVI-to-FVC transformation coefficients for different climate types, land cover, and vegetation types were trained using MODIS data.
3.1 Algorithm Theory
The main methods for determining FVC from remotely sensed data are the empirical method based on vegetation index, the lookup table (LUT) method based on the radiation transfer model, and the artificial neural network method based on the radiation transfer model[7,8]. Vegetation index characterizes the plant growth and vegetation coverage conditions, and is positively correlated with the spatial distribution of vegetation density. NDVI is the most widely used VI. It can be used to monitor the vegetation growth and extract other feature information. A greater NDVI value indicates superior vegetation growth conditions and a higher FVC. The empirical algorithm used is[8]
 (1)
(1)
where FVC is the FVC of the target pixel, and NDVI is the corresponding NDVI; k is the non-linear exponent and NDVImax and NDVImin are the NDVI of pure vegetation and bare soil, respectively. These coefficients are difficult to obtain accurately because of the influence of soil, vegetation type, chlorophyll content, and other factors. Nevertheless, they can be determined through statistical analysis of spatial and temporal NDVI data[2]. For
Table 1 Summary of the China-ASEAN FVC metadata
|
Items
|
Description
|
|
Dataset full name
|
1 km/ 5 day fractional vegetation cover product over China-ASEAN (2013)
|
|
Dataset short name
|
MuSyQ-FVC-1km-2013
|
|
Authors
|
Mu, X. H. L-4762-2016, The State Key Laboratory of Remote Sensing Science, School of Geography, Beijing Normal University, muxihan@bnu.edu.cn
Liu, Q. H. S-1647-2016; State Key Laboratory of Remote Sensing Science, Institute of Remote Sensing and Digital Earth, Chinese Academy of Sciences, liuqh@radi.ac.cn
Ruan, G. Y. A-3311-2017, The State Key Laboratory of Remote Sensing Science, School of Geography, Beijing Normal University, rgyanlj@163.com
Zhao, J. A-3272-2017, State Key Laboratory of Remote Sensing Science, Institute of Remote Sensing and Digital Earth, Chinese Academy of Sciences, zhaojing1@radi.ac.cn
Zhong, B. L-4528-2016, State Key Laboratory of Remote Sensing Science, Institute of Remote Sensing and Digital Earth, Chinese Academy of Sciences, zhongbo@radi.ac.cn
Wu, S. L. S-1572-2016, State Key Laboratory of Remote Sensing Science, Institute of Remote Sensing and Digital Earth, Chinese Academy of Sciences, wsl0579@163.com
Peng, J. J. S-1261-2016, State Key Laboratory of Remote Sensing Science, Institute of Remote Sensing and Digital Earth, Chinese Academy of Sciences, rspeggy@163.com
|
|
Geographical region
|
10°55′12″S-53°32′24″N, 73°37′12″E–141°0′36″E
The region covers the area of the following 11 nations: Brunei, Cambodia, China, Indonesia, Laos, Malaysia, Myanmar, Philippines, Singapore, Thailand, and Vietnam.
|
|
Time
|
Jan. 2013–Dec. 2013
|
|
Temporal resolution
|
5 days
|
|
Spatial resolution
|
1 km
|
|
Data format
|
.tif
|
|
|
|
Data size
|
2.4 GB
|
|
|
|
Data publisher
|
Global Change Research Data Publishing & Repository, http://www.geodoi.ac.cn
|
|
Foundation(s)
|
Ministry of Science and Technology of P. R. China (2012AA12A304, 2012AA12A305, 2013AA12A301)
|
|
Address
|
No. 11A, Datun Road, Chaoyang District, Beijing 100101, China
|
|
Data sharing policy
|
Data from the Global Change Research Data Publishing & Repository includes metadata, datasets (data products), and publications (in this case, in the Journal of Global Change Data & Discovery). Data sharing policy includes: (1) Data are openly available and can be free downloaded via the Internet; (2) End users are encouraged to use Data subject to citation; (3) Users, who are by definition also value-added service providers, are welcome to redistribute Data subject to written permission from the GCdataPR Editorial Office and the issuance of a Data redistribution license; and (4) If Data are used to compile new datasets, the ‘ten per cent principal’ should be followed such that Data records utilized should not surpass 10% of the new dataset contents, while sources should be clearly noted in suitable places in the new dataset[6]
|
example, time-series NDVI data can be analyzed statistically, and the maximum time-series NDVI is used as the NDVI of vegetation, whereas the minimum time-series NDVI is used as the NDVI of bare soil. Furthermore, the maximum and minimum NDVIs of the investigated area can be directly selected as the NDVI values for vegetation and bare soil, respectively.
The common problem with the current methods for obtaining NDVImax and NDVImin is the large uncertainty in the results, which is severely affected by the temporal and spatial distribution of remotely sensed data. This paper presents a quantitative method to calculate the two empirical coefficients by combining the fine- and coarse-resolution remotely sensed data. This method can reduce the errors induced by using empirical parameters.
3.2 Algorithm Implementation
The algorithm implementation includes two main steps: (1) training of NDVI-to-FVC transformation coefficients for different climate types, land cover, and vegetation types; and (2) generating FVC products using Equation (1). The flow chart is shown in Figure 1.
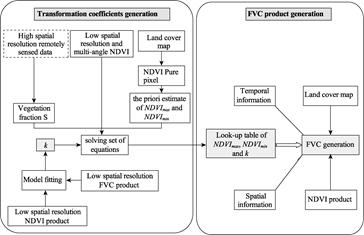
Figure 1 Flowchart of FVC estimation method
The specific technical processes include the following steps:
(1) Generation of empirical transformation coefficients
The LUT for the three NDVI-to-FVC empirical coefficients was established for different vegetation zones and land cover types. First, the nonlinear coefficient k was acquired by model-fitting using existing FVC and NDVI datasets. Second, the vegetation fraction S was obtained using high-spatial-resolution remotely sensed data. The prior estimates of NDVImax and NDVImin were determined through statistical analysis of NDVI at pure pixels obtained using a land cover map and the coarse-resolution NDVI dataset. Then, equations were constructed with Equation (1) and directional FVC via the Beer-Lambert law to calculate NDVImax and NDVImin. Finally, the LUT was generated for different vegetation zones and land cover types.
(2) FVC production
The FVC product was generated in different vegetation zones divided by vegetation regionalization in China. For each zone, NDVI-to-FVC transformation coefficients were first obtained by considering the spatial and temporal information. Subsequently, FVCs were calculated at a pixel-by-pixel level for every vegetation region.
4 Results and Validation
4.1 Spatial Distribution
The dataset of 1 km fractional vegetation cover in the China-ASEAN region has two storage directories. The first-level storage directory is organized by date with five-day intervals. The second-level storage directory is organized by column and row numbers, encoded consistently with the MODIS titles. Figure 2 shows the spatial distribution of the annual maximum FVC in the China-ASEAN region in 2013.
4.2 Data Validation
Two validation methods were used for the FVC dataset. One was direct comparison using high-spatial-resolution remote-sensing data or geostatistical analysis methods to scale up the ground measurements (e.g., the DIRECT dataset in the Geoland project) to moderate spatial resolution pixels for comparison and evaluation. The other was an inter-comparison with existing FVC products (i.e., GEOV1 FVC).
4.2.1 Direct Comparison
The in situ FVCs measured in the Huailai experiment during 2010 and in the Heihe experiment during 2012[9] were used to validate the accuracy of the algorithm.
|
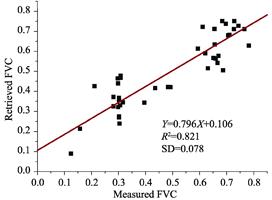
Figure 3 Scatterplot between FVC measurements and 250 m estimated MODIS FVC
|
|

Figure 2 The spatial distribution of annual maximum FVC in the China-ASEAN region (2013)
|
For the Huailai data, FVC measurements were first extracted from the digital pictures, and then the relationship between the measurements and estimated FVC was established using GPS coordinates. Because the sampling sites were selected in uniform regions and can be used to represent MODIS pixels with 250 m resolution, the FVC measurements were directly upscaled to validate the 250 m FVC estimates and draw the corresponding scatterplot (Figure 3). Figure 3 reveals an R2 value of 0.821 and a standard deviation (SD) of 0.078. This indicates that the correlation between retrieved FVC and measured FVC is very good and that the retrieved FVC results are acceptable.
|
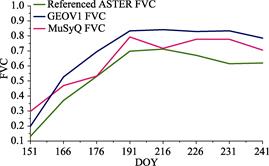
Figure 4 Averaged FVC time series of upscaled ASTER data, MuSyQ FVC, and GEOV1 FVC in the Heihe Basin
|
For the Heihe data, we compared three FVC datasets. First, the empirical relationship between ASTER NDVI and FVC measurements was established by empirical regression to acquire the ASTER FVC. Then, referenced ASTER FVC was obtained by scaling up the ASTER FVC to 1 km resolution. Finally, the averaged FVC of the referenced ASTER FVC, the fraction of green vegetation cover product (i.e., GEOV1 FVC) derived from SPOT/VEGETATION data during the GEOLAND2 project, and the retrieved FVC (i.e., MuSyQ FVC) were calculated to obtain the FVC time series (Figure 4). Figure 4 shows that the MuSyQ FVC time series lies between the two curves of referenced ASTER FVC and GEOV1. This indicates that the FVC retrieved from the proposed algorithm is superior to the GEOV1 FVC dataset.
4.2.2 Inter-comparison
The Greater Mekong Subregion (GMS) in Southeast Asia was chosen as the inter-comparison region. The product to be verified was MuSyQ FVC, and the validation data was GEOV1 FVC. Table 2 shows the detailed information about these data.
After preprocessing, the spatial distribution of the two FVC datasets were compared. Figure 5 shows three pairwise comparisons from the results. Although MuSyQ FVC still contains missing data across the spatial range, it exhibits superior performance to GEOV1 FVC in terms of spatial continuity.
Table 2 Information about the inter-comparison data
|
Dataset name
|
Temporal resolution
|
Spatial resolution
|
Temporal span
|
|
MuSyQ FVC
|
5 days
|
1 km
|
2013.5.24–2013.9.23
|
|
GEOV1 FCOVER
|
10 days
|
1/112°
|
2013.5.24–2013.9.23
|

Figure 5 Spatial comparison of MuSyQ FVC and GEOV1 FVC
Table 3 and Figure 6 show the bias in the GMS validation region and the corresponding FVC time series curve, respectively. The validation results indicate that the trends of the MuSyQ FVC and GEOV1 FVC time series are consistent, while the values of MuSyQ FVC are lower than those of GEOV1 FVC.
Table 3 Numerical statistical results in the GMS validation region
|
Days of Year (DOY)
|
146
|
156
|
166
|
176
|
186
|
|
Bias
|
−0.030
|
−0.034
|
−0.066
|
−0.147
|
−0.129
|
|
Days of Year (DOY)
|
216
|
226
|
236
|
256
|
266
|
|
Bias
|
−0.105
|
−0.091
|
−0.178
|
−0.113
|
−0.049
|
The spatial and temporal continuity of MuSyQ FVC was obviously superior to that of GEOV1 FVC. Even when affected by massive clouds and rain, the effective area of MuSyQ FVC was double as large as that of the area of GEOV1 FVC during several time periods in the summer of 2013, especially in Laos, Myanmar, and Thailand. However, the time-series values of MuSyQ FVC fluctuated over these phases. This might be due to the quality reduction of MuSyQ FVC induced by the clouds, rains, and the quality of the MuSyQ NDVI product.
|
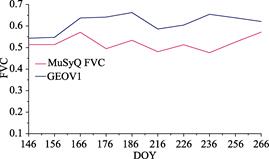
Figure 6 FVC time series of MuSyQ FVC and GEOV1 FVC in the GMS validation region
|
5 Discussion and Conclusion
The proposed FVC estimation algorithm makes full use of the information from remotely sensed data at different resolutions. The vegetation fraction can be directly obtained from high-spatial- resolution data to reduce the heterogeneity influence of the low-resolution data when training the NDVI-to-FVC conversion coefficients.
The algorithm calculates NDVI-to-FVC transformation coefficients by combining the existing remotely sensed data and datasets. First, the representative pure pixels were obtained by combining the land cover map and vegetation regionalization map. Then, the prior estimates of NDVImax and NDVImin were determined through statistical analysis of the coarse-resolution NDVI dataset based on the pure pixels. The nonlinear coefficient k was acquired by model-fitting using existing FVC and the coarse-resolution NDVI dataset. Based on the prior estimates of NDVImax and NDVImin, the nonlinear coefficient k, the NDVI-to-FVC transformation coefficients for different vegetation zones, and land cover types were calculated through solving the established equations.
Finally, the FVC products on a regional and global scale were generated using the three coefficients and the MuSyQ NDVI dataset. Calculation of the transformation coefficients and FVC product generation were conducted independently in this algorithm. This renders the algorithm much easier to implement on a large scale.
Author Contributions
Mu, X. H. and Liu, Q. H. designed the study. Ruan, G. Y. and Zhao, J. wrote the paper. Zhao, J., Zhong, B., Wu, S. L. and Peng, J. J. contributed to the data processing and analysis.
References
[1] Gitelson, A. A., Kaufman, Y. J., Stark, R., et al. Novel algorithms for remote estimation of vegetation fraction [J]. Remote Sensing of Environment, 2002, 80(1): 76-87.
[2] Liang, S., Li, X., Wang, J. Advanced Remote Sensing: Terrestrial Information Extraction and Applications [M]. Pennsylvania: Academic Press, 2012.
[3] Gutman, G., Ignatov, A. Satellite-derived green vegetation fraction for the use in numerical weather prediction models [J]. Advances in Space Research, 1997, 19(3): 477-480.
[4] Gutman, G., Ignatov, A. The derivation of the green vegetation fraction from NOAA/AVHRR data for use in numerical weather prediction models [J]. International Journal of remote sensing, 1998, 19(8): 1533-1543.
[5] Mu, X. H., Liu, X. H., Ruan, G. Y., et al. 1 km/5 day fractional vegetation cover product over China and the Association of Southeast Asian Nations for 2013 [DB/OL]. Global Change Research Data Publishing & Repository, 2015. DOI: 10.3974/geodb.2015.01.17.V1.
[6] GCdataPR Editorial Office. GCdataPR data sharing policy [OL]. DOI: 10.3974/dp.policy.2014.05 (Updated 2017).
[7] Huang, S., Mu, X., Yan, G. Validation of coarse-resolution fractional vegetation cover product in Heihe Basin, China [C]. Proceedings of IGARSS, 2013: 2102-2105.
[8] Mu, X., Huang, S., Ren, H., et al. Validating GEOV1 fractional vegetation cover derived from coarse- resolution remote sensing images over croplands [J]. IEEE Journal of Selected Topics in Applied Earth Observations and Remote Sensing, 2015, 8(2): 439-446.
[9] Song, W., Mu, X., Yan, G., et al. Extracting the Green Fractional Vegetation Cover from Digital Images Using a Shadow-Resistant Algorithm (SHAR-LABFVC) [J]. Remote Sensing, 2015, 7: 10425-10443.