Relationship Dataset and Analysis Between Cultivated Land Transformation and Economic Growth in Guizhou Province, China (2007–2016)
Liu, Q. S. Chen, H.* Chen, J. Wang, C. L. Li, L. Z. Yang, Y. W. Zhang, H. M.
State Engineering Technology Institute for Rocky Desertification Control/School of Karst Science, Guizhou Normal University/South China Karst Eco-Environment Innovation Base/Guizhou Karst Mountain Ecology Environment Provincial Ministry of State Key Experimental Breeding Base, Guiyang 550001, China
Abstract: To explore the relationship between the occupation of cultivated land and the economic coordinated development in Guizhou province, a decoupling index model was used with two important indicators: the amount of cultivated land occupied by construction and the nonagricultural GDP, which were selected from 10 years of statistical data of Guizhou province from 2007 to 2016. An empirical study was conducted to obtain a dataset on the relationship between cultivated land occupation and economic development in Guizhou province. The decoupling curve of cultivated land occupation and economic development in Guizhou province in 2007-2016 generally showed the “M-type” change. The decoupling state showed the dynamics of three periods: a fluctuation adjustment period, a transition stability period, and a fluctuation adjustment period. The best period of cultivated land protection and economic development in the types of decoupling state (strong decoupling) accounted for 33.33% of the statistical period, and the economic of Guizhou province maintained an ideal, virtuous cycle of development. The dataset includes the following contents: (1) the change rate of nonagricultural GDP in Guizhou province from 2007 to 2016; (2) analysis data on decoupling indicators of cultivated land occupation and economic development in Guizhou province from 2007 to 2016. The dataset is archived in .xlsx format, with a data size of 14.2 KB.
Keywords: economy; cultivated land occupation; decoupling analysis; Guizhou province; agriculture
1 Introduction
Human production and life are most closed with the cultivated land resources in the process of economic development. Cultivated land safety plays an important way in ensuring the economic safety, food safety, ecological safety, and even the social stability in China[1]. Since the establishment of P. R. China, particularly since the implementation of reform and opening up policy, Chinese economy has developed by leaps and bounds. However, the
rapid growth of land use for economic construction has had a series of negative impacts on the ecological environment and cultivated land. The regional ecological environment has been destroyed, and the problem is increasingly prominent in the country. The contrasting goals between civil economic development and ecological security bring new challenges[2–3]. The primary reasons for the reduction in cultivated land in China are the over-occupation of land for construction and the adjustment of the agricultural development structure in economic development. Therefore, the protection of cultivated land during economic development is extremely urgent. In recent years, much research in the world has demonstrated the relationship between cultivated land occupation and economic development[4–5]. At present, in countries other than China, the decoupling theory research methods primarily include using decoupling theory models to evaluate the economy and the coordinated development of water resources quantitatively. The Organization for Economic Cooperation and Development (OECD) uses “decoupling” to express the relationship between the economy and the coordinated development of water resources[6]. In 2003, Velmas[7] proposed a comprehensive decoupling based on variables for the decoupling relationship between GDP growth and material consumption in 15 member states of the European Union. The Finnish scholar Tapio proposed a decoupling model and applied it to agricultural development research and further expanded the model into resources, the environment, carbon emissions, and other fields[8].
With the continuous improvement in the application of decoupling theory, research on the methods of decoupling analysis in China has achieved many results to date[9–13]. The theory is primarily used to investigate the problems and countermeasures in the process of GDP growth based on qualitative and quantitative analysis methods, and to examine the relationships of economic aggregates and/or economic growth rate with the indexes such as GDP, carbon emissions, and water pollution levels. Song et al.[9] analyzed the relationship between cultivated land occupation and economic growth and the factors affecting the relationship using 20 years of cultivated land economic development data in Changshu city, Jiangsu province. Chen and Du[10] analyzed the theoretical framework and the system of the decoupling between cultivated land occupation and economic growth. Hu[11] used decoupling theory to analyze the relationship between cultivated land and nonagricultural GDP in China during 1999-2006 and its mechanism. Guo and Yan[12] studied the decoupling relationship between China’s construction land expansion and economic growth since the reform and opening up policy. Du and Chen[13] used national data to study the impact of GDP development on cultivated land occupation. In general, no breakthrough has been developed in the research on land ecological security, with only current status evaluation of land environmental problems. The research on the relationship between cultivated land occupation and economic development using decoupling analysis methods remains at an early stage in China[14–15]. To provide a theory for the protection of cultivated land, land management, and economic development and its regulation in Guizhou province, this study, based on the research results of previous scholars, adopted the decoupling analysis method to study the relationship between cultivated land occupation and economic growth in Guizhou province.
2 Metadata of Dataset
The metadata for the “Dataset of relationship between cultivated land transformation and economic growth in Guizhou province (2007–2016)”[16] includes the following items (Table 1): dataset name, authors, geographic region, dataset format, data files, data publisher, data sharing policy, etc.
3 Data Development Methods
3.1 Overview of the Study Area
Guizhou province is in the hinterland of the Southwest China and belongs to the mountainous landforms of the southwestern plateau of China. The mountains are typical karst mountains. The terrain is high in the west and low in the east and is inclined from the center to the north, east, and south. The average elevation is approximately 1,100 m. The province is connected to Chongqing city in the north, to Sichuan province in the west, to Hunan province in the east, and to Yunnan and Guangxi provinces in the south. The province is an important transportation hub in the southwest. The province has a total area of 176,100 km2, and has 9 prefecture-level administrative divisions and 88 county-level administrative divisions. By the end of 2015, the resident population of Guizhou province was 35,295,500. In 2016, the GDP of the province was 1,173,443 million Yuan, with an increase of 10.5% compared to the previous year, while the added value of the primary industry, namely, agriculture, forestry, animal husbandry, and fishery, was 1,846.54×108 Yuan, 6.0% higher than the previous year. The added value of secondary industry, namely, manufacturing, extractive industries, and the construction industry, was 4,636.7×108 Yuan, increasing by 11.1%. The added value of tertiary industry, i.e., service industry and other nonmaterial production sectors, was 5,251.15×108 Yuan, with an increase of 11.5%. The per capita GDP of the province reached 33,127 Yuan/person, with an increase of 3,280 Yuan/person over the previous year[18].
Table 1 Metadata summary for “Dataset of relationship between cultivated land transformation and economic growth in Guizhou province (2007–2016)”
|
Items
|
Description
|
|
Dataset full name
|
Dataset of relationship between cultivated land transformation and economic growth in Guizhou province (2007–2016)
|
|
Dataset short name
|
LandTransformationEconomicsGuizhou_2007–2016
|
|
Authors
|
Liu, Q. S. L-7869-2018, School of Karst Science, Guizhou Normal University, 364845045@qq.com;
Chen, H., School of Karst Science, Guizhou Normal University, gy_chenhu@163.com
|
|
Geographical region
|
Guizhou, China Year 2007–2016
|
|
Data format
|
.xlsx Data size 14.2 KB
|
|
Dataset files
|
The amount of cultivated land occupation and nonagricultural GDP in Guizhou province from 2007 to 2016
|
|
Foundation(s)
|
Ministry of Science and Technology of P. R. China (2016YFC0502601)
|
|
Data publisher
|
Global Change Research Data Publishing & Repository, http://www.geodoi.ac.cn
|
|
Address
|
No. 11A, Datun Road, Chaoyang District, Beijing 100101, China
|
|
Data sharing policy
|
Data from the Global Change Research Data Publishing & Repository includes metadata, datasets (data products), and publications (in this case in the Journal of Global Change Data & Discovery). The data sharing policy is as follows: (1) Data are openly available and can be freely downloaded via the Internet; (2) End users are encouraged to use data subject to citation; (3) Users, who are by definition also value-added service providers, are welcome to redistribute data subject to written permission from the GCdataPR Editorial Office and the issuance of a data redistribution license; and (4) If data are used to compile new datasets, the ‘10% principal’ should be followed, i.e., the data records extracted from this data set are less than 10% of the new data set, and simultaneously data sources are labelled[17]
|
3.2 Research Methods and Data Sources
3.2.1 The Concept of Decoupling Cultivated Land Occupation from Economic Development and Its Model
Chinese scholar Li, Jianming introduced the decoupling theory into China for the first time and applied it to China’s environmental resource assessment, when participating in an OECD (Organization for Economic Cooperation and Development) energy environmental assessment project[19]. According to the decoupling analysis methods, generally, the relation between the prohibition of cultivated land occupation and economic development and their unsynchronized variation rate with time, are jointly called decoupling[20], that is, when the GDP growth rate is greater than that of the occupation of cultivated land, it is called “relative decoupling”. The economic development is the growth of nonagricultural GDP. When the growth rate of land occupied by construction land is zero or negative, it is called “absolute decoupling”. In this study, two main indicators, occupied land by construction and nonagricultural GDP output, were selected as the decoupling indicators in the model. Based on decoupling theory and the method proposed by the OECD, the following decoupling elastic coefficient model was used[21]:
 (1)
(1)
|
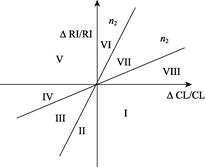
Figure 1 Decoupling degree coordinates
|
where n represents the nth year; Qn represents the decoupling elasticity of the nth year; RIn represents the amount of cultivated land occupied in the nth year; RIn-1 represents the amount of cultivated land occupied by construction in the (n–1)th year, CLn represents the nonagricultural GDP of the nth year, and CLn-1 represents the nonagricultural GDP in the (n–1)th year.
3.2.2 Decoupling Elastic Metrics
Based on the theoretical methods of decoupling analysis by Tapio[8] and Li et al.[18], 0.8 and 1.2 are usually used as the criteria for evaluating the state of the decoupling elastic value. η1 and η2 are commonly used to represent the decoupling elastic threshold values of 0.8 and 1.2, respectively. The decoupling metrics and the decoupling degree measurement standards are shown in Figure 1 and Table 2.
As shown in Table 2, according to the division method of Tapio[9], the decoupling elastic values of 0.8 and 1.2 were used as the critical values of the decoupling state, and the decoupling elastic critical values were represented by η1 and η2, respectively. The decoupling state was divided into four major sections and eight state types, as shown in Table 3.
3.2.3 Data Source
The data used in this paper were primarily from the statistical data released by the Statistics Bureau of Guizhou province and the official website of the Guizhou Provincial Department of Land and Resources. Among the data, the GDP data of Guizhou province primarily refer to the collection of “Statistical Data” from the official website of the Guizhou Provincial Bureau of Statistics. The Statistical Bulletin of Social Development is based on the annual published GDP.
The data on the occupation of cultivated land in Guizhou province were primarily from the “Construction Land” of the “Information Disclosure Catalogue” in the “Government Disclosure Catalogue” column in the official website of the Ministry of Land and Resources of Guizhou province and “Publication of the construction land approval from the People’s Government of Guizhou”, according to the annual statistics for construction land. Finally, the “Guizhou province’s Social and Economic Statistics (2007–2016)” and “Guizhou province Land Use Change Data (2007–2016)” were used as supplementary references[22].
Table 2 Decoupling metrics
|
Interval
|
ΔCL/CL
|
ΔRI/RI
|
Qn
|
Decoupling Type
|
|
I
|
+
|
–
|
Qn<0
|
Strong decoupling
|
|
II
|
–
|
–
|
η2<Qn
|
Decline decoupling
|
|
III
|
–
|
–
|
η1<Qn<η2
|
Decline decoupling
|
|
IV
|
–
|
–
|
0<Qn<η2
|
Weak negative decoupling
|
|
V
|
–
|
+
|
Qn<0
|
Strong negative decoupling
|
|
VI
|
+
|
+
|
η2<Qn
|
Expansion negative decoupling
|
|
VII
|
+
|
+
|
η1<Qn<η2
|
Expansion connection
|
|
VIII
|
+
|
+
|
0<Qn<η2
|
Weak decoupling
|
Table 3 Decoupling interval value and decoupling state
|
Interval
|
Interval value
|
Decoupling type
|
|
I
|
(–∞, 0)
|
Strong decoupling
|
|
V
|
Strong decoupling
|
|
VIII
|
(0, 0.8)
|
Weak decoupling
|
|
IV
|
Weak negative decoupling
|
|
VII
|
(0.8, 1.2)
|
Expansion connection
|
|
III
|
Decline decoupling
|
|
VI
|
(1.2, +∞)
|
Expansion connection
|
|
II
|
Decline decoupling
|
4 Data Results and Analysis
4.1 Economic Development in Guizhou Province
|

Figure 2 Nonagricultural GDP output value and nonagricultural GDP change rate in Guizhou province from 2007 to 2016
|
As shown in Figure 2 and Table 4, for the 10 years from 2007 to 2016, the economic development of Guizhou province was rapid, and the nonagricultural GDP grew continuously during those 10 years. In general, the economy developed rapidly and increased from 3,956.6×108 Yuan in 2007 to
13,104.69×108 Yuan in 2016. The
increase was nearly 4-fold in 10 years, and the total value increased by 9,148.09×108 Yuan. The change rate was slower before 2010, but it accelerated after 2010, with an overall trend of steady growth; whereas the 10-year GDP change rate rebounded slightly in 2010, and the overall trend showed a decline in volatility. The GDP output value was largest in 2011, compared with the previous years, while the smallest growth rate was in 2015. The growth rate rebounded in 2016. The overall GDP growth rate of Guizhou province in the 10-year period decreased primarily due to the small amount of the previous economic aggregate. Therefore, the change in growth rate was high. In the later period, the economic aggregate was large and the rate of change in economic growth was small, but the economy of Guizhou province continued to maintain a growth rate of at least 10% per year. In general, as shown in Figures 2 and 3, the occupation of cultivated land and the nonagricultural GDP output in Guizhou province maintained a growth trend in the 10-year period. The trend for the nonagricultural GDP output value showed a steady increase, whereas the nonagricultural GDP output increased steadily but the occupation of cultivated land showed increased fluctuantly.
Table 4 Analysis of decoupling indicators of cultivated land occupation and economic growth in Guizhou province from 2007 to 2016
|
Year
|
Occupied cultivated land (hm2)
|
Change rate of occupied cultivated land (%)
|
Nonagricultural GDP
(108 Yuan)
|
Change rate of Nonagricultural
GDP (%)
|
Decoupling elasticity
|
Decoupling type
|
|
2007
|
3,956.60
|
-
|
2,254.61
|
-
|
-
|
-
|
|
2008
|
4,278.58
|
8.14
|
2,785.55
|
23.55
|
0.35
|
Weak decoupling
|
|
2009
|
2,816.23
|
-34.18
|
3,339.49
|
19.89
|
-1.72
|
Strong decoupling
|
|
2010
|
6,301.40
|
123.75
|
3,963.64
|
18.69
|
6.62
|
Expansion negative decoupling
|
|
2011
|
7,642.09
|
21.28
|
4,975.62
|
25.53
|
0.83
|
Expansion
connection
|
|
2012
|
19,337.46
|
153.04
|
5,912.18
|
18.82
|
8.13
|
Expansion negative decoupling
|
|
2013
|
7,064.21
|
63.47
|
6,977.74
|
18.02
|
-3.52
|
Strong decoupling
|
|
2014
|
12,418.42
|
75.79
|
7,975.56
|
14.30
|
5.30
|
Expansion negative decoupling
|
|
2015
|
13,948.60
|
12.32
|
8,861.94
|
11.11
|
1.11
|
Expansion
connection
|
|
2016
|
13,104.69
|
6.05
|
9,887.89
|
11.58
|
-0.52
|
Strong decoupling
|
4.2 Decoupling Analysis of Cultivated Land Occupation and Economic Development
|
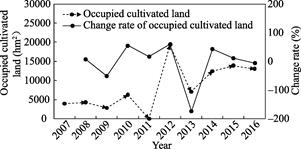
Figure 3 The amount of cultivated land occupied by construction and the rate of change of cultivated land in construction in Guizhou province from 2007 to 2016
|
4.2.1 Decoupling Indicators
According to decoupling theory, the relationship between the cultivated land occupation and economic development in Guizhou province were annlyzed from 2007 to 2016. As shown in Table 4 and Figure 4, the decoupling relationship between cultivated land occupation and economic development was primarily characterized by weak decoupling (2008), strong decoupling (2009, 2013, 2016), expansion negative decoupling (2010, 2012, 2014), and expansion connection decoupling (2011 and 2015). For the frequency of decoupling type, the expansion decoupling and expansion negative decoupling type were highest among the four types of decoupling states, accounting for 66.67% of the total number of statistical periods. However, the expansion connection type accounted for 22.22% of the total number of statistical periods. The weak decoupling accounted for the least (11.11%). The best period of cultivated land protection and economic development (strong decoupling) accounted for 33.33% of the statistical period.
From the overall trend, the decoupling between the occupied cultivated land and economic development showed an unstable state, and the overall change was of the “M-type”. Construction land was continuously increasing, while the decoupling state recovered to the strong decoupling periodically, indicating that the economic development in Guizhou province during the 10-year period was good, and the pressure of cultivated land occupied by construction was relatively high. In recent years, there are still great challenges to protect the cultivated land resource in Guizhou province.
|
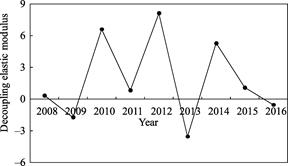
Figure 4 Decoupling elastic coefficient of cultivated land and economic development in Guizhou province from 2007 to 2016
|
4.2.2 Dynamic Analysis of Decoupling
The decoupling elasticity of occupied cultivated land and economic development in Guizhou province was dynamic in the 10-year period, which could be roughly divided into three stages: 2008–2009, 2010–2013, and 2014–2016 (Table 4, Figure 4). The analysis for each stage are as follows.
The first stage (2008-2009) was a fluctuation adjustment period. Overall, the decoupling state changed from a weak decoupling at the beginning to a subsequent strong decoupling at the end. It was characterized by a small fluctuation range and a decreasing decoupling elastic coefficient, decreasing from 0.35 in 2008 to –1.72 in 2009. The amount of cultivated land occupied by construction during this period showed a decreasing trend. As shown in Figure 3, the amount of cultivated land occupied by construction changed from 4,278.58 hm2 in 2008 to 2,812.23 hm2 in 2009; while the nonagricultural GDP increased from 2,785.55×108 Yuan in 2008 to 3,339.49×108 Yuan occurred in 2009. The amount of cultivated land occupied by construction decreased, while the nonagricultural GDP increased. The change rate of nonagricultural GDP value decreased, while the change rate of cultivated land occupied by construction also decreased on year-on-year basis (Figure 3).
The above results showed that from the perspective of the status of cultivated land protection and economic development, the situation in this stage was good. From the perspective of the development of the two, the health changed from the good state to the ideal state. The cultivated land occupied by construction in Guizhou province in 2009 was reduced primarily due to the economic lag effect. The State Council promulgated the “Notice on Strengthening Land Regulation and Control (Guo Fa [2006] No. 31)” document issued in 2006. The document requires the people’s governments at all levels to take the overall responsibility for land use development and land planning in areas under their administration, strictly implement an accountability system, strengthen local land management, require and strict land approval. In addition, the economy in Guizhou province in 2008 was subject to the international finance crisis. With the intervene of the government and the industry reconstructing, the real estate market was shocked, which limits the occupation of cultivated land by construction, and thus the amount of cultivated land occupation decreased greatly.
The second stage (2010–2013) was a transitional stable period. There were four decoupling states in this stage: a first expansion negative decoupling type to an expansion connection type, then to a second expansion negative decoupling type, and finally to a strong decoupling type. In this stage, the elastic coefficient of decoupling changed greatly and showed a fluctuate decreasing trend, with the highest value of 8.13 in 2012, and the lowest value of –3.52 in 2013. Compared with the first stage, the amount of cultivated land occupied by construction increased at first and then decreased, with an overall increasing. The nonagricultural GDP changed greatly and rebounded from the overall declining trend. The change rate in 2012 was largest, reaching 18.82%. The change rate of nonagricultural GDP showed a negative relationship with that of the cultivated land occupied by construction in 2011 and 2012. In 2013, both of them decreased on a year-on-year basis, and the change rate of cultivated land occupied by construction was greater than that of nonagricultural GDP. The amount of cultivated land occupied by construction increased suddenly to 19,337.46 hm2 in 2012, with an increase of 11,695.37 hm2 compared to 2011, two-fold higher than that in 2011. Hence, the change rate reached the maximum in this stage. From the perspective of the healthy development for the occupied cultivated land and economic development, the health changed from the non-ideal state to an ideal state with a continuous increasing economy and a decreasing amount of cultivated land occupied by construction. Generally, the development state in this stage was good.
The third stage (2014–2016) was another fluctuation adjustment period. The decoupling stage experienced three dynamic changes in this stage: expansion negative decoupling, expansion connection, and strong decoupling, with a decreasing decoupling state index in the three years. As shown in Figure 4, the decoupling index was largest in 2014 (5.30) and smallest in 2016 (–0.52). During this period, the change in the amount of cultivated land occupied by construction was relatively smooth, while the nonagricultural GDP increased steadily. As shown in Figure 3, the change rate of the occupied cultivated land was largest in 2014 (75.79%) and lowest in 2016 (–6%). The change rate of the nonagricultural GDP decreased first and then increased, with the lowest value of 11.11% in 2015 in the 10-year period (Figure 2). However, the cultivated land occupied by construction reached 1,984.60 hm2 in 2015. The nonagricultural GDP reached the maximum value of 9,887.89×108 Yuan in 2016 in the 10-year period. The relationship between the occupied cultivated land by construction and economic development changed from an unsatisfactory state to an optimal state in this stage.
The above results indicated that the decoupling state of occupied cultivated land and economic development in Guizhou province was in the transition period. The developing state was good in this period. The economy increased steadily, while the occupied cultivated land was maintained a slow increase during the last 10 years, indicating that Guizhou province continuously adjusted the optimal development strategy of economic development and land protection while developing the economy. The trend of occupying cultivated land in Guizhou province was effectively prevented, alleviating the antagonistic relationship between the protection of cultivated land and economic development in Guizhou province.
5 Conclusion and Suggestion
5.1 Conclusion
The decoupling theory was adopted in this study to evaluate the relationship between cultivated land occupation and economic development in Guizhou province, China, with cultivated land occupied by construction and nonagricultural GDP as the main indicators to analyze the economic development in Guizhou province from 2007 to 2016. Main conclusions are as follows.
(1) The relationship between the changes of cultivated land occupation and the nonagricultural GDP in Guizhou province from 2007 to 2016 mainly showed four states. Among the states, the total number of strong decoupling and expansion negative decoupling state types accounted for the largest proportion, 66.67% of the total number of statistical periods. In 3 out of 10 years, the relationship was in a strong decoupling state, indicating that during the research period, the traditional development model at the expense of cultivated land resources was eliminated in Guizhou province.
(2) The decoupling state of Guizhou province from 2007 to 2016 showed an “M-type” change over the 10 years. The economic development status showed the virtuous cycle, from an initial, unsatisfactory state to the optimal state, and then the unsatisfactory state, finally to the ideal state. Although the strong decoupling state was short in the second period, the economy developed fast, indicating that the dependence of economic development on land use of construction was weakened, and the mutually influencing relationship between the two was weakened. However, in the last 10 years, the amount of occupied cultivated land in Guizhou province continued to show an expanding trend, which was primarily related to the need to occupy the cultivated land to meet the development needs of urbanization in the economic development.
(3) In general, the decoupling elastic coefficient between the occupied cultivated land by construction and economic development in Guizhou province in the 10-year period was unstable and could be divided into three stages, namely, a fluctuation adjustment period, a transitional stable period, and a fluctuation adjustment period. First, in the stage from 2008 to 2009, the decoupling elastic coefficient of both occupied cultivated land and economic development changed little, and the decoupling state changed from weak decoupling to strong decoupling, the amount of cultivated land occupied by construction was continually reduced, and the pressure of constructing cultivated land was constant. In the second stage (2010–2013), the decoupling elastic coefficient changed significantly, and the decoupling state showed expansion negative decoupling, expansion connection, expansion negative decoupling, and strong decoupling. The occupation pressure of cultivated land by construction increased first, then decreased, synchronized with the economic development, increased, and finally decreased continuously to reach the optimal state of economic development. In the third stage (2014-2016), the decoupling elastic coefficient showed a trend of decrease. The decoupling state changed dynamically from the expansion negative decoupling, to weak decoupling, and finally to the strong decoupling. The pressure on the occupation of cultivated land also showed a declining trend, finally forming the ideal state of economic development.
5.2 Suggestion
The following suggestions are made based on the results.
(1) Adjust the industrial structure and accelerate the industrial transformation
Fully take the advantages of local climate and geography and utilize the leading role of big data industry; further accelerate industrial transformation and improve land use efficiency by optimizing resource allocation; develop new technological industries and tertiary industries such as tourism, service industry and financial industry.
(2) Sound the land supervisory system and perfect the land approval procedure
Firstly, establish and improve relevant laws and regulations for land management and approval; Secondly, strictly legislate on land, strengthen the law enforcement, and make efficient and rational use of land; Finally, improve the quality of law enforcement personnel and improve the process of land approval.
(3) Develop moderately in a sustainable way and utilize the resources reasonably according to the plan.
Land development should be arranged according to the geographical and geomorphological characteristics of Guizhou Province, and land evaluation should be carried out before land use. land use planning should be made scientifically, and land use planning should be strictly carried out in the process of urbanization, following the principle of sustainable development strictly.
References
[1] Li, J., Nan, L. Research on the value connotation and calculation method of cultivated land resources—taking Shaanxi province as an example [J]. Arid Land Resources and Resources, 2010, 24(9): 10–15.
[2] Yang, K., Chen, B. M., Song, W. Decoupling of cultivated land occupation and GDP growth in Hebei province [J]. Journal of Resources Science, 2009, 31(11): 1940–1946.
[3] Li, Y. P., Cai, Y. L. Evaluation of land ecological security in Hebei province [J]. Journal of Peking University (Natural Science), 2007, 23(6): 784–789.
[4] Hao, H. J., Cai, G. P., Luo, X. Q., et al. Early warning of cultivated land ecological security in Guizhou province from 2000 to 2010 based on energy value analysis [J]. Soil and Water Conservation Research, 2013, 20(6): 307–310.
[5] Cao, Y., Chen, H., Qin, Y. L., et al. Type synthesis of fully-decoupled 2T2R parallel mechanisms based on driven-chain principle [J]. Journal of Harbin Institute of Technology, 2016, 23 (5): 45–52.
[6] Yang, R. F., Wang, T. W. Decoupling of water resources utilization and economic coordinated development in Jiangxi province—based on virtual water perspective [J]. Science and Technology Management Research, 2015, 35(20): 95–98, 111.
[7] Velmas, J. Global trends of linking environ-mental stress and economic growth [J]. Turku School of Economics and Busies Administration, 2003, 18(7): 55–60.
[8] Tapio, P. Towards A theory of Decoupling: Degrees of Decoupling in the EU and the case of Roae Traffic in Finland between 1970 and 2001 [J]. Transport policy, 2005, 12(2): 137–151.
[9] Song, W., Chen, B. M., Chen, W. Decoupling Evaluation of Cultivated Land Occupation and Economic Growth in Changshu City [J]. Journal of Natural Resources, 2009, 24(9): 1532–1540.
[10] Chen, B. M., Du, H. L. On the decoupling of cultivated land occupation and GDP growth [J]. Resources Science, 2006, 28(5): 36–42.
[11] Hu, Z. C. Decoupling of China’s Cultivated Land Resources and Non-agricultural Economic Development [A]. China Natural Resources Society Land Resources Research Committee, China Geography Society Agricultural Geography and Rural Development Committee. China’s mountainous land resources development and utilization and people Coordinated Development Research [C]. China Natural Resources Society Land Resources Research Committee, China Geography Society Agricultural Geography and Rural Development Committee: China Natural Resources Society, 2010: 7.
[12] Guo, L., Yan, J. M. Research on decoupling of occupied farmland and economic growth in China [J].
Chinese Journal of Population, Resources and Environment, 2007, 17(5): 48–53.
[13] Du, H. L., Chen, B. M. Research on rationality of construction occupation of farmland based on decoupling analysis method [J]. Transactions of the Chinese Society of Agricultural Engineering, 2007(4): 52–58.
[14] OECD. Decoupling: a conceptual overview [J]. OECD Papers, 2005, 11(7): 208–211.
[15] Jiang, Y., Chen, F. M., Wang, Z. Early warning of agricultural ecological security based on the energy analysis in Wu’an city [J]. Agricultural Engineering, 2011, 27(6): 319–323.
[16] Liu, Q. S., Chen, W. Analysis of the relationship between cultivated land occupation and economic growth in Guizhou Province (2007-2016) [DB/OL]. Global Change Science Research Data Publishing & Repository, 2018. DOI: 10.3974/geodb.2018.07.02.V1.
[17] GCdataPR Editorial Office. GCdataPR data sharing policy [OL]. DOI: 10.3974/dp.policy.2014.05 (Updated 2017).
[18] Baidu Baike. Guizhou [OL]. https://baike.baidu.com/item/%E8%B4%B5%E5%B7%9E/37015?fromtitle =%E8%B4%B5%E5%B7%9E%E7%9C%81&fromid=20475641&fr=Aladdin.
[19] Li, J, M., Zhou, C., Y., Zeng, Y. E., et al. Construction and coupling analysis of sustainable energy development indicators in Taiwan [J]. Journal of Taiyuan University of Technology, 2010, 41(5): 474–478.
[20] Zhong, T. Y., Huang, X. J., Wang, B. Y. Decoupling analysis of economic growth and construction land expansion [J]. Journal of Natural Resources, 2010, 25(1): 18–31.
[21] Zhang, Y., Wang, Y. H., Zhang, L. Q., et al. Decoupling between cultivated land occupied by construction and economic development in Anhui province [J]. China Land Sciences, 2013, 27(5): 71–77.
[22] Guizhou Provincial Department of Natural Resources. Publicity of Construction Land Approved by People’s Government of Guizhou from January to December 2016 [OL]. http://www.gz.stats.gov.cn/ tjsj_35719/.