Sub-bottom Seismic Profile Dataset Developed by Both in Situ and Energy Ratio Analysis in Heihai Lake, Qinghai-Tibet Plateau
Sun, Y. K.1* Feng, X. W.2 Wang, Z. H.1 Deng, H.1
1. Zhejiang Huadong Construction Engineering Co., Ltd., Hangzhou 310000, China??
2. Qiushi Academy for Advanced Studies, Zhejiang University, Hangzhou 310000, China
Abstract: The shallow stratigraphic seismic profile data collected by the GeoPulse 3.5 kHz shallow stratigraphic profile system in Heihai Lake ( or Black Sea), in the northern Qinghai-Tibet Plateau, was used to calculate the energy ratio curve of the profile data. The field measurements data were from three sections (3 sn, 4 ns, and 4 we). The data for these three profiles contains 3,001, 1,918, and 8,001 data points, respectively, with each of them consisting of 1,664 samples. The energy ratio interpretation data included 3 sn profile stratigraphic boundary data; single channel profile data and 19 columns of energy ratio data; a parameterization scheme ((Lmin-Lmax)/Lwin) and the number of extracted boundary points; (Lmin-Lmax) value scheme; different Lwin extraction effects; Heihai Lake (Black Sea) single-channel seismic profile data, and western single-channel seismic profile data. The dataset was archived in .kmz, .shp, .txt, and .xlsx formats with the data size of 73.9 MB (compressed to one file of 27.7 MB).
Keywords: Qinghai-Tibet Plateau; Heihai Lake; shallow earthquake; measured data; energy ratio method
1 Introduction
Shallow stratigraphic profile detection technology is widely used in geological surveys of oceans, lakes, and other geographic features. The stratigraphic information contained in the profile data can provide basic input for engineering construction and scientific research[1–2]. The traditional manual interpretation of profile data is time-consuming and subjective. Therefore, it is tempting to automatically extract the formation information contained in the seismic wave, by means of data conversion and other pre-processing.
The amplitude attribute in seismic data contains the formation information. To automatically extract this formation information using a computer, firstly it is necessary to convert the profile data in a special format into a computer-readable format[3]. Then the correspondence between two sequences was used to extract the formation information. Finally, the profile data are processed in batches by computer to interpret the whole profile data.
Based on this method, Liu et al. extracted seabed topographic data from shallow stratigraphic data using the maximum amplitude method based on the reflection characteristics of the seismic wave amplitude on the seabed surface[4]. Xu et al. conducted the automatic picking of first arrival waves in shallow seismic data by improving the traditional energy ratio method[5].
The shallow stratigraphic seismic profile data were from the Heihai Lake (Black Sea) on the Qinghai-Tibet Plateau. The study region is located in the Kunlun River-Yi Niugou fault valley to the north of the East Kunlun Mountains in the northern part of the Qinghai-Tibet Plateau. The average elevation is 4,477 m, extending along the NE-SW line of the valley, with an area of 38.7 km2, and a maximum depth at the center of the lake of 21.9 m[6]. The Heihai Lake (Black Sea) is located in the plateau region, with limited human activities, low suspended matter concentration, and only weak impact from noise in the surrounding environment of the lake. This is conducive to data collection. Before the profile data were automatically interpreted, the profile data were converted from SEG-Y format into computer-operable data in txt format, and the appropriate automatic extraction parameter set was selected by the parameterization scheme. The optimized energy ratio was selected using the selected parameter set. The method calculated the energy ratio of each seismic record, extracted the boundary points using the mean curve method, and then eliminated the outliers through a continuity test of the boundary points. Finally, the stratigraphic maps were produced by automatic interpretation.
2 Metadata of Dataset
3 Methodology
The data adopted in this paper are shallow seismic section data collected in the Heihai Lake (Black Sea) (Figure 1) in the northeastern part of the Qinghai-Tibet Plateau in 2011. Field data were collected using a GeoPulse 3.5 kHz shallow formation profile system (Kongsberg GeoAcoustics Ltd., Great Yarmouth, UK). Under ideal conditions, the effective detection depth can reach 70 m. The system consists of four 3.5 kHz transducers with a tow body, transmitter, receiver, and GeoPro II workstation. The main parameter values set during the data acquisition were a pulse emission period and recording length of 100 ms and a signal acquisition rate of 60 μs. The high-low pass filter 300 Hz–7 kHz, gain was 6 dB or 9 dB, and the data were stored in SEG-Y format.
Table 1 Metadata summary of sub-bottom seismic profile dataset developed by both in situ and energy ratio analysis in Heihai Lake, Qinghai-Tibet Plateau
|
Article
|
Description
|
|
Dataset full name
|
Sub-bottom seismic profile dataset developed by both in situ and energy ratio analysis in Heihai Lake, Qinghai-Tibet Plateau
|
|
Dataset short name
|
SubSeismicProfileHeihaiTibet
|
|
Authors
|
Sun, Y. K. A-4112-2017, Zhejiang Huadong Construction Engineering Co., Ltd., sun_yk@ecidi.com
Zhang, R. Q. A-5164-2017, School of Computer Science, Fudan University, 734722018@qq.com
Zhou, L. F., Nanjing University, 812975031@qq.com
Dai, C. A-4153-2017, 8Nanjing University, 12975031@qq.com
Zhang, Y. Z. A-3143-2017, Nanjing University, zhangyzh@nju.edu.cn
|
|
Geographical area
|
Lakes in the northeast of the Qinghai-Tibet Plateau—Heihai Lake (Black Sea) (35°59'13.84"N, 93°15'51.87"E)
|
|
Year
|
2011
|
Research area
|
8.98 km×4.41 km
|
|
Data Format
|
.xlsx, .txt, .shp, .kmz
|
|
|
|
Data size
|
27.7 MB (after compression)
|
|
Data files
|
Geographical location of the Heihai Lake (Black Sea) on the Tibetan Plateau: HeihaiLake.kmz
Three shallow sections of data collected on site: SeismicProfileData_4ns.txt, SeismicProfileData_3sn, and SeismicProfileData_4we.txt
Interpreted data obtained through interpretation: ProssedSeismicProfileData.xlsx
|
|
Foundation(s)
|
Ministry of Science and Technology, P. R. China (2013CB956500); Jiangsu Provincial Natural Science Fund Key Project (BK20130056)
|
|
Publisher
|
Global Change Research Data Publishing & Repository, http://www.geodoi.ac.cn
|
|
Address
|
No.11, Datun Road, Chaoyang District, Beijing 100101, China
|
|
Data sharing policy
|
Data from the Global Change Research Data Publishing & Repository includes metadata, datasets (data products), and publications (in this case, in the Journal of Global Change Data & Discovery). The Data sharing policy is as follows. (1) Data are openly available and can be freely downloaded via the Internet; (2) End users are encouraged to use Data subject to citation. (3) Users, who are by definition also value-added service providers, are welcome to redistribute Data subject to written permission from the GCdataPR Editorial Office and the issuance of a Data redistribution license. (4) If Data are used to compile new datasets, the ‘10% principal’ should be followed such that any Data records utilized should not surpass 10% of the new dataset contents, while sources should be clearly noted in suitable places in the new dataset[8]
|
|
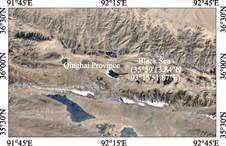
Figure 1 Geo-location of the Heihai
Lake (source: Google Earth)
|
3.1 Algorithm
(1) SEG-Y Data Format Conversion
In the study, the method used to process the SEG-Y file was converting the SEG-Y file to a decimal text file (.txt). The format of the final text file included fixed information regarding the track number and the number of samples taken for each data point, followed by the seismic profile data.
(2) Energy Ratio Method
The data about a complete seismic section consists of several seismic records, and the single-seismic record are stored as seismic wave amplitude values for discrete sampling points. The time window is defined at the sampling point of a single track record, and its size is in the unit of the number of sample points. The energy ratio is calculated as follows[9]:
 (1)
(1)
 (2)
(2)
where R is the energy ratio of the second half of the time window (T0–T2) to the first half (T1–T0), x(t) is the seismic record amplitude value, T1 is the time window start point, T0 is the time window midpoint, T2 is the time window end point, E is the relative energy of a single track, N is the total number of samples of a single track, and α is the stability factor.
(3) Calculation of the Energy Ratio Mean Curve
Firstly, it is necessary to average the calculated energy ratio curve to obtain an energy ratio mean curve. The mean curve of the energy ratio can identify the position of the peak more clearly than the energy ratio curve.
(4) Boundary Point Extraction and Continuity Test
1) Boundary point extraction
The boundary point appears as the peak in the energy ratio curve. In this study, the mean value curve method was used to extract the peak value of the energy ratio curve. In the mean curve method, the variable length sliding time window method was also used to determine the peak point.
2) Boundary point continuity test
|

Figure 2 Flowchart of the dataset development
|
The basic principle of the boundary point continuity test is to traverse all the boundary points in the section, determine whether there are a certain number of other points in the specified depth range of each point, and specify a number of adjacent recording ranges. If a point met these criteria, this point will be considered as a boundary point and will be kept; otherwise, this point will be considered as an isolated point and will be removed[10].
3.2 Technical Route
In the automatic interpretation of the profile data, the profile data of the SEG-Y format were firstly converted into a common data file in the .txt format, and then the energy ratio curve and the energy ratio mean curve of each profile data point were calculated. Finally, a boundary point extraction was performed. A continuity test was applied to obtain the target boundary. The data processing was demonstrated in Figure 2.
4 Results and Validation
4.1 Data Files
This dataset includes:
(1) Geographical location data for the Heihai Lake (Black Sea) on the Qinghai-Tibet Plateau in. kmz format: HeihaiLake.kmz.
(2) Three shallow datasets in txt format, converted from raw data collected in the Heihai Lake (Black Sea) in 2011: SeismicProfileData_4ns.txt, SeismicProfileData_3sn.txt, and SeismicProfileData_4we.txt.
(3) Data from Interpretation in .xlsx format: ProssedSeismicProfileData.xlsx.
|
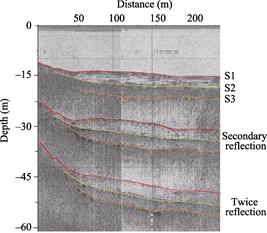
Figure 3 Artificial visual interpretation results
for the Heihai Lake (Black Sea) 3s n profile[10]
|
1) Heihai Lake (Black Sea) 3 sn profile stratigraphic line data
The number of artificially interpreted boundary points was determined according to the number of stratigraphic boundaries crossed in each seismic record. The number of vertical points of the boundary points was recorded during the statistical analysis, and finally all the boundary points in a section and corresponding samples were obtained (Figure 3).
2) Single channel seismic profile data and 19 columns of energy ratio data
In this study, the mean value curve method was used to extract the peak value of the energy ratio curve. To highlight the energy ratio feature of each point, variance was calculated before comparing the energy ratio and mean value, and several values which differed greatly from the mean value were eliminated until the variance of the remaining values was within a presurposed range or the number of culling values reached the maximum of presurposed number, and finally the mean value of the remaining data were calculated to obtain a mean curve. In the mean curve method, the variable length sliding time window method was also used to determine the peak point.
3) Parameterization scheme ((Lmin–Lmax)/Lwin) and boundary point extraction effect
In the interpretation of the section, the length range of the sliding window (Lmin–Lmax) and the peak value of the peak extraction window (Lwin) were the main parameters affecting the interpretation accuracy (Figure 4). The parameterization scheme was based on these two sets of parameters. It was important to obtain the best parameterization scheme for extraction (Figure 5). The extraction effect was measured by the boundary point density and the boundary line similarity.
(4) Interpretation data for 4 ns profile and 4 we profile
According to the technical route and parameters used in section interpretation ((Lmin–Lmax) =2–20, Lwin = 76), the sections with an obvious stratification of the two layers in the Heihai Lake (Black Sea) (4 ns, 4 we) were selected for interpretation. Interpretation data for the entire profile were obtained (Figure 6).
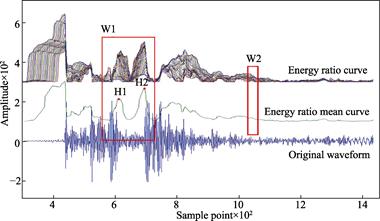
Figure 4 Energy ratio curve, energy ratio mean curve, and the original waveform of a single track record[10]
4.2 Data Validation
To verify the reliability of the parameter set, two sections of the Heihai Lake (Black Sea) (4 ns, 4 we) were selected for interpretation. Parameterization scheme was shown in Table 2.
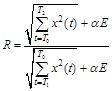
Figure 6 is a plot of the boundary line for the automatic extraction of two sections. The stratigraphic boundary automatically extracted from the section 4 ns agreed well with the artificially identified stratigraphic boundary[10]. In the shallow stratum of 25 m, the stratigraphic boundaries S2 and S3 were in good agreement. In the depth range of 25-45 m, the stratigraphic boundaries S4 and S5 were consistent. Below a depth of 45 m, sediment stratification revealed by seismic reflection signals was not obvious, and it was difficult to identify obvious stratigraphic boundaries. The unconformity surface S2 could be automatically extracted in a section of continuous undulating valley with a section of 4 we, and the trend of S3 in the depth range of 30-45 m was basically consistent with manual interpretation.
Table 2 Parameterization scheme ((Lmin–Lmax)/Lwin) and boundary point extraction effect[9]
|
Serial number
|
Data name
|
Data descriptions
|
Data numbers
|
|
1
|
Parameterization scheme ((Lmin–Lmax)/Lwin) and number of extraction boundary points
|
The number of boundary points extractedwhen Lwin takes values of 2, 8, 20, 50, 70, and 100, and (Lmin–Lmax) takes values 2–20, 4–40, 6–60, 8–80, and 10–100
|
30
|
|
2
|
When (Lmin–Lmax) takes 2–-20, the extraction effect of different Lwin values
|
The boundary point density and boundary line similarity when (Lmin–Lmax) takes values of 2–20, 6–60,and 8–80, and Lwin takes values of 2, 8, 20, 50, 70, and 100
|
30
|
|
3
|
When(Lmin–Lmax) takes 6–60, the extraction effect of different Lwin values
|
30
|
|
4
|
When (Lmin–Lmax) takes 8–80, the extraction effect of different Lwin values
|
30
|
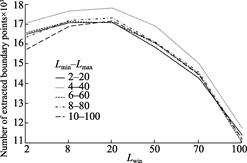
Figure 5 Boundary point extraction effect of different Lwin and (Lmin–Lmax) values[10]

(The top picture shows the section 4 ns; the lower picture shows the section 4 we)
Figure 6 Automatically extracted stratigraphic boundary[10]
5 Discussion and Conclusion
The Heihai Lake (Black Sea) dataset of the Qinghai-Tibet Plateau is based on the energy ratio method of variable-length sliding time window optimization. The parameter set was used to select the appropriate parameter set to realize the automatic interpretation of shallow stratum profile data. This method can be applied to interpret batches of shallow stratigraphic profile data obtained from the same area, and produce stratigraphic map of the profile, which can help to establish the basic stratigraphic framework of a study area, and provide an important basis for further manual interpretation and detailed analyses. In addition, the method used in the present paper can be tuned for other research areas to obtain the optimal interpretation of shallow stratigraphic profile data based on tailored parameterization schemes. A shortcoming of the current method is that it cannot extract the stratigraphic boundary in sub-stratum level with sufficient accuracy. Therefore, it is necessary to further optimize parameterization, or to pre-process the profile data with a better approach. The preliminary analysis of the dataset showed that it can successfully extract most of the stratigraphic boundaries in the shallow stratigraphic data of the Heihai Lake (Black Sea), and the accuracy of the main stratigraphic boundaries in the two sections was more than 60%. This level of accuracy will enable the use of the data.
References
[1] Teng, J. W. The journey of three scientific problems and innovation in seismic exploration [J]. Progress in Geophysics, 2014, 29(3): 0971-0992. DOI: 10.6038/pg20140301.
[2] Lafferty, B., Quinn, R., Breen, C. A side-scan sonar and high-resolution chirp sub-bottom profile study of the natural and anthropogenic sedimentary record of Lower Lough Erne, northwestern Ireland [J]. Journal of Archaeological Science, 2006, 33(6): 756-766. DOI: 10.1016/j.jas.2005.10.007.
[3] Zhang, R. Q. Extraction of seismic wave data in SEG-Y format and boundary point identification research [D]. Nanjing: Nanjing University, 2012.
[4] Liu, X. J., Gao, S., Yang, Y. A preliminary study on the distortion effect in method for correcting windwave-induced images of GeoChirp??subbottom profiler [J]. Advances in Marine Science, 2007, 25(2): 160-167.
[5] Xu, Y., Duan, W. X., Xu, W. X., et al. The improvement of automatic first break picking based on energy ratio [J]. Geophysical & Geochemical Exploration, 2010, 34(5): 595-599.
[6] Zhou, L. F. Study on the evolution process of the sedimentary environment since Later Pleistocene in Heihai Lake, Northern Tibet Plateau [D]. Nanjing: Nanjing University, 2014.
[7] Sun, Y. K., Zhang, R. Q., Zhou, L. F., et al. Sub-bottom seismic profile dataset developed by both in situ and energy ratio analysis in Heihai Lake, Qinghai-Tibet Plateau [DB/OL]. Global Change Research Data Publishing & Repository, 2016. DOI: 10.3974/geodb.2016.09.10.V1.
[8] GCdataPR Editorial Office. GCdataPR data sharing policy [OL]. DOI: 10.3974/dp.policy. 2014.05 (Updated 2017).
[9] Liu, X. W., Zhang, N., Gou, Y. F., et al. The comparison and application of time-frequencyanalysis methods to seismic signal [J]. Progress in Geophysics, 2008, 23(3): 743-753.
[10] Sun, Y. K., Zhang, R. Q., Zhou, L. F., et al. Automatic interpretation of the sub-bottom seismic profile based on energy ratio method [J]. Progress in Geophysics, 2015, 30(3): 1141-1150. DOI: 10.6038/pg20150318.