Climate Comfortable Period and Uncomfortable
Period Dataset Using Modified Model in Mainland of China (1981–2010)
Yu, D. D.1,2 Li, S.1,2,3 *
1. School of Geographic Sciences, East China Normal
University, Shanghai 200241, China;
2. Key Laboratory of Geographic Information Science,
Ministry of Education, Shanghai 200241, China;
3. Institute of Eco-Chongming, Shanghai 200241, China
Abstract: Climate-comfortable
period (CCP), as a temporal index, has a far-reaching, long-term impact on
human settlements and human activities. Based on the long term daily
meteorological data (from 1981 to 2010) from 814 national basic meteorological
observing stations throughout China, climate comfortable and uncomfortable
period dataset is carried out. Meanwhile, the ??seasonal anchor method??, which
can be adopted as a national standard, are generated and modified the threshold
values of each level of thermal sensation for THI (Temperature and Humidity
Indexes) and WEI (Wind Effect Index). The dataset included: (1) Annual average
climate comfortable and uncomfortable period in provinces during 1981–2010; (2) Annual average climate comfortable period and
uncomfortable period of prefecture-level cities in China during 1981–2010; (3) Annual average comfortable period and uncomfortable
period in China during 1981–2010; (4)
Evolution of the annual average comfortable period and uncomfortable period of
814 basic meteorological stations in China during 1981–2010. The dataset was archived in .xlsx format with a data size of
152 KB after compression.
Keywords: thermal index;
climatic comfort; climate comfortable period; THI; WEI
Dataset Available Statement:
The dataset supporting this paper
was published at: Yu, D. D., Li, S. Climate
comfortable period and uncomfortable period dataset using modified model in
mainland of China (1981-2010) [J/DB/OL]. Digital Journal of Global Change Data Repository,
2020. DOI: 10.3974/geodb.2020.01.02.V1.
1 Introduction
Climatic comfort is the condition of mind that expresses
satisfaction with the thermal environment and is assessed by subjective
evaluation (ANSI/ASHRAE Standard 55)[1], which has a far-reaching
impact on human settlements and human activities[2–3]. Studies on
climate comfortableness degree analysis are of substantial significance to
building development[4–5], urban
planning[6–7], public health[8–9], travel behavior[10–12]
etc., especially important for the development of vacation destinations.
Based on daily meteorological data from 814 basic weather stations in China
during 1981–2010 provided by the China Meteorological Data Science Center
(CMDC), a 7-level scale of thermal sensation, which includes ??torrid, hot,
warm, neutral, cool, cold, and frozen??, is proposed. This study used the
modified Temperature Humidity Index (THI) and Wind Effect Index (WEI) to fit
the representative climatic comfort in China since the 1980s. And climate
comfort and discomfort period in China are evaluated, which brings us some
meaningful discoveries[13].
2 Metadata of the Dataset
??Climate comfortable period and uncomfortable period dataset using
modified model in mainland of China (1981–2010)??[14] is summarized in Table 1. It includes the dataset full name, short name,
authors, year of the dataset, temporal resolution, spatial resolution, data
format, data size, data files, data publisher, and data sharing policy, etc.
Table 1 Metadata summary of the dataset
|
Items
|
Description
|
|
Dataset full name
|
Climate comfortable
period and uncomfortable period dataset using modified model in mainland of
China (1981–2010)
|
|
Dataset short name
|
CCP and CUCP_ China??s urban scale _1981-2010
|
|
Authors
|
Yu, D. D. AAA-3856-2020, School of Geographic Sciences, East China
Normal University, Yudd0713@outlook.com
Li, S. M-6399-2017, School
of Geographic Sciences, East China Normal University, sli@geo.ecnu.edu.cn
|
|
Geographical region
|
Mainland of China
|
|
Year
|
1981–2010
|
|
Spatial resolution
|
1 km??1 km
|
|
Data format
|
.xlsx
|
|
Data size
|
152 KB
|
|
Data files
|
1 file
including 4 sheets
|
|
Foundation
|
Ministry of Science and Technology of P. R. China (2012CB955803)
|
|
Data publisher
|
Global Change Research Data Publishing & Repository,
http://www.geodoi.ac.cn
|
|
Address
|
No. 11A, Datun Road, Chaoyang District, Beijing 100101, China
|
|
Data sharing policy
|
Data from
the Global Change Research Data Publishing & Repository includes metadata, datasets (in the Digital Journal of Global Change Data Repository), and publications
(in the Journal of Global Change Data & Discovery). Data sharing policy includes: (1) Data
are openly available and can be free downloaded via the Internet; (2) End
users are encouraged to use Data subject to citation; (3)
Users, who are by definition also value-added service providers, are welcome
to redistribute Data subject to written permission from the GCdataPR
Editorial Office and the issuance of a Data redistribution license; and (4)
If Data
are used to compile new datasets, the ??ten per cent principal?? should be
followed such that Data records utilized should not
surpass 10% of the new dataset contents, while sources should be clearly
noted in suitable places in the new dataset[15]
|
|
Communication and
searchable system
|
DOI, DCI, CSCD, WDS/ISC,
GEOSS, China GEOSS, Crossref
|
3 Methods
3.1 Data
Sources
The
meteorological observation data required in the analysis is the standard value
of the surface climate dataset in China collected from 1951 to 2010 was
provided by the China Meteorological Data Science Center (CMDC)[16]. With 814 National Reference
Climatological Station (NRCS) and National Basic Meteorological Observing
Station (NBMOS) in China, this dataset includes station attribute information
(e.g., station ID, longitude, latitude) and mean daily climatology data (e.g.,
temperature, humidity, precipitation, sunshine, wind speed), which have been
used extensively in climate-related research across China. Based on the
availability and stability of the data, we selected 814 meteorological stations
nationwide from 1981 to 2010.
3.2 Algorithm
The
comfort levels were evaluated using the Temperature Humidity Index (THI)[17] and the Wind Effect Index (WEI)[18],
while the evaluation standards were modified by a new approach named ??seasonal
anchor method?? in this paper[13], which includes 4 steps ??grading,
naming, anchoring, and projecting??.
 (1)
(1)
 (2)
(2)
where t is
the daily air temperature (??C), RH is
the daily relative humidity (%), v is
the average wind speed (m·s–1), S is the total hours of sunshine (h),
and D is the daytime length.
4 Data Results and Validation
4.1 Data Products
(1) Annual average climate comfortable and uncomfortable
period in provinces during 1981–2010; (2) Annual average climate comfortable
period and uncomfortable period of prefecture level cities in China during
1981–2010; (3) Annual average comfortable period and uncomfortable period in
China during 1981–2010; (4) Evolution of the annual average comfortable period
and uncomfortable period of 814 basic meteorological stations in China during
1981–2010, and the variations between them from 1981–1995 to 1996–2010.
4.2 Data Analysis
The
method using the Thiessen polygon to weight each station??s climate comfortable
and uncomfortable period was applied in his study. Based on the THI (Equation
1) and WEI (Equation 2) and the corresponding comfort threshold criteria, which were modified by ??seasonal anchor method??, we
calculated the average climate comfortable
and uncomfortable period in China using two different models respectively
(Table 2).
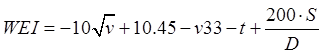
The comparison of THI value with WEI shows their
better consistency. Based on the analysis of Figure 1, as
far as comfortable periods are concerned, the southern is long and the northern
is short. Among them, Yunnan province ranked the first, which provides a
solid foundation for ??Kunming every day is spring??, which means it is a good
place to escape the hot summer and the frozen winter. The adjacent province
Tibet autonomous region has the
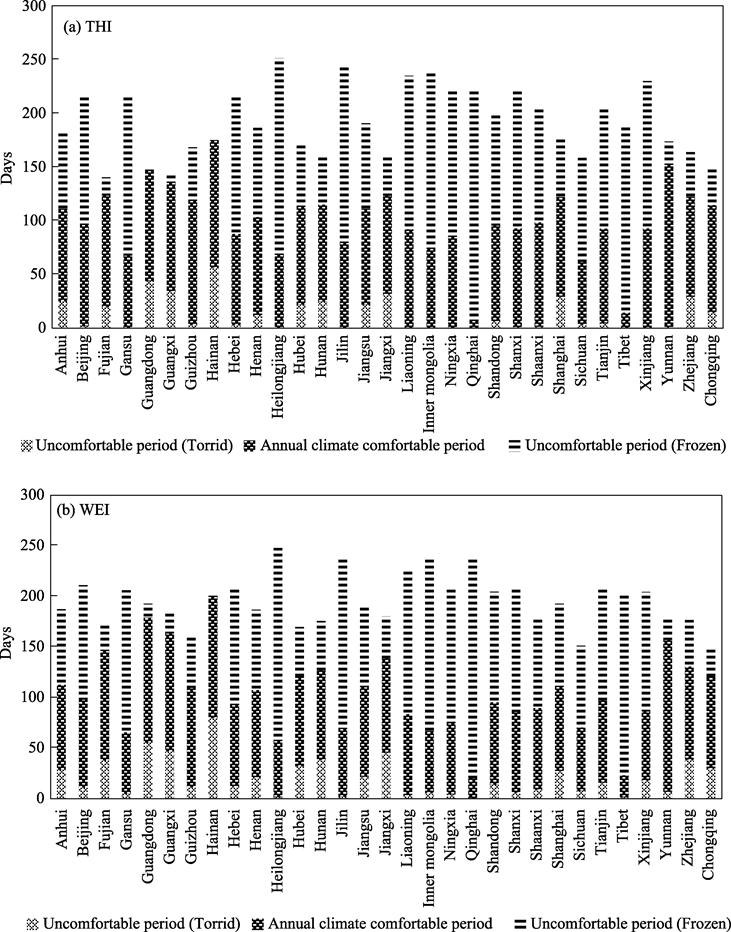
Figure 1 Annual average comfortable and
uncomfortable periods of the provinces from 1981 to 2010
shortest
period of comfortable. Hainan, Guangdong and Guangxi province became high value
centers for torrid period. High altitude areas such as Qinghai province and
Tibet autonomous region become extreme centers of frozen discomfort. Also, we
evaluated the historical changes during the annual average
climate comfortable period and uncomfortable period in China. In general, the uncomfortable period is much
longer than the comfortable period, and the frozen period is much longer than
the torrid period. As in other parts of the world, China has experienced
noticeable changes in climate over the past years. The trend of climate warming
in China is projected to intensify in the future. Methods provided similar
results and formed an interactive verification indicating that the CCP in most
regions showed an increasing trend from 1981 to 2010.
Table 2 Average annual comfortable period and uncomfortable
period on climate in China (1981–2010) (Unit: day)
|
Climate comfort state
|
Year
|
Spring
|
Summer
|
Autumn
|
Winter
|
|
THI
|
WEI
|
THI
|
WEI
|
THI
|
WEI
|
THI
|
WEI
|
THI
|
WEI
|
|
Comfortable
period
|
73.2
|
67.8
|
16.0
|
16.3
|
41.2
|
31.3
|
14.8
|
17.9
|
1.2
|
2.4
|
|
Uncomfortable
period
|
Torrid
|
5.6
|
13.4
|
0.2
|
0.8
|
5.1
|
11.4
|
0.3
|
1.2
|
0
|
0
|
|
Frozen
|
125.6
|
122.7
|
24.4
|
30.0
|
1.2
|
3.1
|
28.2
|
24.2
|
71.9
|
65.4
|
4.3 Data Validation
According to the daily meteorological data of 69 provincial
capitals meteorological stations in China from 1981 to 2010, an
interactive verification between models and air temperature in the levels of
thermal sensation were adopted. In this paper, we used the ordinary kriging
interpolation in the ArcGIS software and rasterized into pixels of dimension 1
km ?? 1 km. Then the annual average comfortable and uncomfortable periods were
obtained under the THI and WEI and their corresponding comfort threshold criteria, which
had a high consistency. Also, in the part of the annual average comfortable and uncomfortable
periods in China during 1981–2010, the results show that the fluctuation of THI
and WEI scales are also consistent.
5 Discussion
and Summary
Using the modified model and daily data from 814 weather
stations in Mainland of China to examine inter-regional differences in the tourist climate comfortable and uncomfortable
period across China and summarizes the spatial-temporal evolution from
1981–2010 in a changing climate, which brings us some meaningful discoveries.
Based on the analysis, as far as comfortable
periods are concerned, the southern is long and the northern is short. Among
them, the annual average CCP of 25 provinces (cities) exceeded the
national average (73.2 days). Yunnan province ranked first (151.9 days)
throughout the year, which was approximately 32 days longer than values
obtained for Hainan province. The climate ranked as less comfortable in Qinghai
and Tibet with 14.7 days and 7.3 days, respectively.
Both methods (THI or WEI) provided similar results and formed an interactive
verification indicating that the CCP in most regions showed an increasing trend
from 1981 to 2010, While the uncomfortable (torrid)
remained basically stale and the uncomfortable (frozen) showed a wavelike
decrease change.
The
studied dataset focused more on the characteristics of the overall situation in
China, such as the length of climate-comfortable period and
climate-uncomfortable period and its spatial patterns in the mainland of China
over the past 30 years. This database measures the climate-comfortable period
and climate-uncomfortable period and combine the information to carry out
??humanistic influence?? research and enrich the associated practical topics.
These results can provide some scientific understandings for human settlements
environmental constructions, and improve understanding of local or regional
resilience responding to global climate change.
Author Contributions
Li, S. made the overall design
of the dataset, including setting the models and algorithms. Yu, D. D.
contributed to data processing and manuscript writing. Yu, D. D. was responsible for collecting the
raw data and the data screening and preprocessing.
References
[1]
ANSI/ASHRAE
Standard 55-2010. Thermal environmental conditions for human occupancy [S].
American Society of Heating, Refrigerating and Air-Conditioning Engineers,
2010: 2-4.
[2]
Shindell, D.,
Kuylenstierna, J. C. I., Vignati, E., et
al. Simultaneously mitigating near-term climate change and improving human
health and food security [J]. Science,
2012, 335(6065): 183-189.
[3]
de
Freitas, C. R., Grigorieva, E. A. A comprehensive catalogue and classification
of human thermal climate indices [J]. International
Journal of Biometeorology, 2015, 59(1): 109-120.
[4] Middel, A., Häb, K., Braze, A. J., et al. Impact of urban form and design
on mid-afternoon microclimate in Phoenix Local Climate Zones [J]. Landscape & Urban Planning, 2014, 122(2): 16–28.
[5]
Chandel, S. S., Sharma, V., Marwah, B. M. Review of energy efficient features in vernacular architecture
for improving indoor thermal comfort conditions [J]. Renewable and Sustainable Energy Reviews, 2016, 65: 459-477.
[6]
Rupp, R. F.,
V??squez, N. G., Lamberts, R. A review of human thermal comfort in the built
environment [J]. Energy & Buildings, 2015, 105: 178–205.
[7]
Djukic, A.,
Vukmirovic, M., Stankovic, S. Principles of climate sensitive urban design
analysis in identification of suitable urban design proposals. Case study: central
zone of Leskovac competition [J]. Energy & Buildings, 2016, 115: 23–35.
[8]
Parsons, K.
Human Thermal Environments: The Effects of Hot, Moderate, and Cold Environments
on Human Health, Comfort, and Performance [M]. New York: CRC Press. 2014.
[9]
Song, C.,
Liu, Y., Zhou, X., et al. Temperature
field of bed climate and thermal comfort assessment based on local thermal
sensations [J]. Building and Environment,
2016, 95: 381–390.
[10] Ridderstaat, J., Oduber, M., Croes, R., et al. Impacts of seasonal patterns of
climate on recurrent fluctuations in tourism demand: evidence from Aruba [J]. Tourism Management, 2014, 41(2): 245–256.
[11] Nalau, J., Becken, S., Noakes, S., et al. Mapping tourism stakeholders??
weather and climate information seeking behavior in Fiji [J]. Weather Climate & Society, 2017, 9(3): 377-391.
[12] Yu, Z. K., Sun, G. N., Luo, Z. W., et al. An analysis of climate comfort
degree and tourism potential power of cities in Northern China in summer to the
north of 40??N [J]. Journal of Natural
Resources, 2015, 30(2): 327-339.
[13] Yu, D. D., Li, S. Scale of human thermal
sensation using seasonal anchor method: a Chinese case study [J]. Journal of Natural Resources, 2019,
34(8): 1633-1653.
[14] Yu, D. D., Li, S. Climate comfortable period and
uncomfortable period dataset using modified model in mainland of China
(1981–2010) [J/DB/OL]. Digital Journal of
Global Change Data Repository, 2020. DOI: 10.3974/geodb.2020.01.02.V1.
[15] GCdataPR Editorial Office.
GCdataPR Data Sharing Policy [OL]. DOI: 10.3974/dp.policy.2014.05 (Updated
2017)
[16] National Meteorological Data Science Center.
China surface climate data daily value dataset [DB/OL]. http:
// data.cma.cn/data/detail/dataCode/A.0029.0001.html.
[17] Thom, E. C. A new concept of cooling degree days
[J]. Air Condition: Heat & Ventilation. 1957, 54(6): 73-80.
[18] Terjung, W. H. Physiologic climates of the
conterminous United States: a bioclimatic classification based on man [J]. Annals of the Association of American
Geographers, 1966, 56(1): 141-179.