Spring Phenological Grid Dataset
of Typical
Deciduous Broad-leaved Woody Plants in the Warm Temperate Zone of China
Dai, J. H.1,2,* Zhu, M. Y.1,2
Wang, H. J.1 Tao, Z. X.1,2 Hu, Z.1,2 Dong, X. Y.3
1. Key Laboratory of Land
Surface Pattern and Simulation, Institute of Geographic Sciences and Natural Resources
Research, Chinese Academy of Sciences, Beijing 100101, China;
2. University of Chinese Academy of Sciences, Beijing
100049, China;
3. School of Earth Science and Resources, Chang??an
University, Xi??an 710054, China
Abstract: Plant phenology is important in assessing the effects of global
change and in studying ecosystem structure and function, as well as in
developing climate and land surface models. The leaf unfolding date
(LUD) and the first flowering date (FFD) of eight woody plants (Fraxinus chinensis Roxb.
(Oleaceae), Salix babylonica L. (Salicaceae), Robinia pseudoacacia
L. (Leguminosae), Albizia julibrissin Durazz. (Leguminosae), Morus
alba L. (Moraceae), Ulmus pumila L. (Ulmaceae Mirb.), Armeniaca
vulgaris Lam. (Rosaceae), Cercis chinensis Bunge. (Leguminosae))
from 1963 to 2015 were obtained from the Chinese Phenological Observation
Network. The 0.5?? ?? 0.5?? grid data of the LUD and FFD were developed for each
species in the past 50 years by building and testing three phenological models:
Unified, UniChill, and Temporal?CSpatial Coupling (TSC) model. The verification
results showed that the average simulation error of the LUD was approximately
5?C9 days and that of the FFD was approximately 5?C12 days. The data set includes
the following: (1) header file, containing grid data header information of the
species phenophase and spatial distribution; (2) phenophase, containing the LUD
and FFD of each species from 1963 to 2015; and (3) spatial distribution,
containing the actual spatial distribution range grid of each species. The data
set consists of three folders and 1,713 files. The data files are stored in
TXT, GEOTIFF, and ARCGIS ASCII formats. The data volume is 74.5 MB before
compression (9 MB after compression).
Keywords: Spring phenology; Woody
plants; Leaf unfolding date; First flowering date; China
1 Introduction
Plant
phenology is the seasonal behavior of plants during an annual cycle that is
influenced by diverse environmental factors (including climate, hydrology, and
soil)[1] Because of the influence of the environment, phenology is
highly sensitive to climate change and has become an important indicator for
recording and evaluating the effects of global changes on ecosystems[2]
In recent decades, the increase in spring temperature has led to a substantial
advance in plant spring phenology in the Northern Hemisphere, thereby substantially
influencing carbon and water cycles and the nutrient balance in terrestrial
ecosystems.[3] Thus, plant phenological data are also important in
indicating the impact of global change, in understanding the structure and
function of ecosystems, as well as in developing climate and land models. The
authors of this paper developed and published grid data of the spring phenology
of individual species based on the Chinese Phenological Observation Network
(CPON)[4] Then, using primarily the manual observation data of CPON,
they greatly improved understanding of the phenological temporal?Cspatial
patterns and their causes in China[5,6] According to the experience
of other researchers, widely distributed and well observed plant species were
selected to produce multispecies grid data sets, which displayed the changes in
the phenological temporal?Cspatial patterns of Chinese woody plants in spring.
The grid data sets also improve the use of Chinese phenological data in
understanding global change. In addition, the team is currently participating
in the special project of ??earth big data science and engineering??, in which Chinese
phenological data products are an essential part of gathering and sharing
ground monitoring data. Therefore, the purpose of this paper is to publish the
methods and basic results of the spring phenological temporal?Cspatial data set
of Chinese woody plants. The data set contains the grid data of the spring
phenophase (the leaf unfolding date (LUD) and the first flowering date (FFD))
of eight typical deciduous broad-leaved woody plants in China from 1963 to 2015
and provides the scale transformation from station phenology to regional
phenology in China.
2 Metadata of Data set
The
metadata of the spring phenological grid data set of typical deciduous
broad-leaved woody plants in the warm temperate zone of China[7] are
summarized in Table 1. It includes the data set full name, short name, authors,
year of the data set, temporal resolution, spatial resolution, data format,
data size, data files, data publisher, and data sharing policy.
Table 1 Metadata summary of the spring
phenological grid data set of eight typical deciduous broad-leaved woody plants
in the warm temperate zone of China (1963?C2015)
|
Items
|
Description
|
|
Dataset full name
|
Spring
phenological grid data set of typical deciduous broad-leaved woody plants in
the warm temperate zone of China
|
|
Dataset short name
|
SpringPhenologyWoodyPlantWarmTZChina
|
|
Authors
|
Dai
Junhu Researcher ID, Institute of Geographic Sciences and Natural Resources Research,
Chinese Academy of Sciences, daijh@igsnrr.ac.cn
Zhu
Mengyao AAA-7619-2019, Institute of Geographic Sciences and Natural Resources
Research, Chinese Academy of Sciences, zhumy.16b@igsnrr.ac.cn
Wang
Huanjiong AAA-7674-2019, Institute of Geographic Sciences and Natural Resources
Research, Chinese Academy of Sciences, wanghj@igsnrr.ac.cn
Tao
Zexing AAA-7688-2019, Institute of Geographic Sciences and Natural Resources
Research, Chinese Academy of Sciences, taozx.12s@igsnrr.ac.cn
Hu
Zhi AAE-4801-2019, Institute of Geographic Sciences and Natural Resources Research,
Chinese Academy of Sciences, huz.18b@igsnrr.ac.cn
Dong
Xiaoyu Researcher ID, Chang??an University, dongxy@igsnrr.ac.cn
|
|
Geographical region
|
China: 18??N?C54??N, 72??E?C136??E
|
|
Year
|
1963?C2015 Temporal
resolution 1 year
|
(To be continued on the next page)
(Continued)
|
Items
|
Description
|
|
Spatial resolution
|
0.5????0.5??
|
|
Data format
|
TXT, GEOTIFF, ARCGIS ASCII
|
|
|
|
Data size
|
74.5MB (before compression) 9.0MB (after
compression)
|
|
Data files
|
The
dataset consists of header file, phenophase, spatial distribution;
Phenophase: the leaf unfolding date (LUD), the first flowering date (FFD);
Species: Fraxinus chinensis, Salix babylonica, Robinia pseudoacacia, Albizia julibrissin, Morus alba, Ulmus pumila, Armeniaca
vulgaris, Cercis chinensis.
|
|
Foundations
|
|
|
Data Computing Environment
|
MATLAB, campus
license of Institute of Geographical Sciences and Natural Resources Research,
Chinese Academy of Sciences
ArcGIS campus license of
Institute of Geographical Sciences and Natural Resources Research, Chinese
Academy of Sciences
|
|
Data publisher
|
Global Change Research Data Publishing &
Repository, http://www.geodoi.ac.cn
|
|
Address
|
Institute
of Geographic Sciences and Natural Resources Research (IGSNRR), Chinese Academy
of Sciences. No. 11A, Datun Road, Chaoyang District, Beijing 100101, China
|
|
Data sharing policy
|
Data from the Global
Change Research Data Publishing & Repository includes metadata, dataset
(data products), and publications (in this case, in the Journal of Global Change
Data & Discovery). Data sharing policy includes: (1) Data are openly
available and can be free downloaded via the Internet; (2) End users are
encouraged to use Data subject to citation; (3) Users, who are by definition
also value-added service providers, are welcome to redistribute Data subject to written permission from the GCdataPR Editorial Office and
the issuance of a Data redistribution license; and (4) If Data are used to
compile new dataset, the ??ten per cent principal?? should be followed such
that Data records utilized should not surpass 10% of the new
dataset contents, while sources should be clearly noted in suitable places in
the new dataset[8]
|
|
Communication and searchable system
|
DOI, DCI, CSCD, WDS/ISC, GEOSS, China GEOSS
|
3 Methods
3.1 Basic Data Collection
The
LUD and the FFD of eight woody plants from 1963?C2015 were extracted from the Chinese
Phenological Observation Network (CPON). The eight plants were Fraxinus chinensis Roxb. (Oleaceae), Salix babylonica L.
(Salicaceae), Robinia pseudoacacia
L. (Leguminosae), Albizia julibrissin Durazz. (Leguminosae), Morus alba L. (Moraceae), Ulmus
pumila L. (Ulmaceae Mirb.), Armeniaca vulgaris Lam. (Rosaceae), Cercis chinensis Bunge.
(Leguminosae), which are typical species of deciduous broad-leaved
forests in the warm temperate zone of China[9] The temperature data
were derived from the China
Meteorological Data Service Center (CMDSC,
data.cma.cn). The daily temperature data of the corresponding stations and time
periods in the ??China surface daily climate dataset (v.3.0)?? were used for the
parameterization of phenological models, whereas the grid average daily
temperature data obtained from the ??China surface 0.5?? ?? 0.5?? daily temperature
grid dataset (v. 2.0)?? were used for phenophase simulation and scale expansion.
3.2 Algorithm Principle
To develop the spring phenological grid data,
three steps were included: building phenological models, estimating the
corresponding parameter values, and validating the models[10] To
obtain the most accurate simulation of phenophase, three models were tested:
the Unichill model[11], the Unified model[11], and the
Temporal?CSpatial Coupling (TSC) model[12], which was based on the
spring warming (SW) model. The minimum root mean square error (RMSE) of the
three spring phenological models was used to select the optimal phenological
model to simulate the LUD and FFD temporal?Cspatial patterns of each species in
the past 50 years.[13]
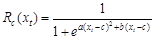
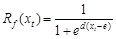
(1) The Unified
model divides the process of bud burst into two phases: dormancy and
quiescence, with nine species-specific parameters (a, b, c, d, e, w, k, C*, and tc) fit to
phenological observations. Parameters a, b, and c define the response function to temperature (Rc(xt),
also called ??chilling units??, eq. (1)). Parameters d and e define the other response
function to temperature (Rf (xt), also
called ??forcing units??, eq. (2)). Parameter t0 is the time
when Rc(xt) begins to accumulate, which
determines the threshold C* of the cumulative sum of chilling units (eq.
(3)). Parameters w, k, and tc
determine the threshold F* of the cumulative sum of forcing units
(eq. (4)). tb is the time of LUD or FFD when  reaches the threshold F*.
 (1)
(1)
 (2)
(2)
 (3)
(3)
 (4)
(4)
(2) The UniChill
model is a simplified version of the Unified model, which contains seven
parameters: a, b, c, d, e, C*, and F*.
On the basis of Unified model, this model fixes the time t1 for the start of the forcing units as September 1 of
the previous year and assumes that the accumulation of forcing units (F*)
required for the start of the spring phenology each year is fixed.
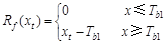
(3) The TSC model
is built on the SW model[14] (eqs. (5, 6)), which uses the winter
average temperature to reflect the difference in the accumulated temperature
threshold[15] (eq. (7)). The TSC model includes six parameters: Tb1,
F*, t0, a, b, and f. Rf(xt)
is the forcing unit, xt is the average daily temperature on
day t, and Tb1 is the critical temperature.
F* is the threshold value of temperature accumulation. The temperature
accumulation threshold Fi of different sites is determined by
the winter (December of the previous year to February) temperature  of site i and
parameters a, b, and f. t0 is the time when the forcing unit begins to accumulate,
and y is the time of LUD or FFD when
of site i and
parameters a, b, and f. t0 is the time when the forcing unit begins to accumulate,
and y is the time of LUD or FFD when  reaches F*.
 (5)
(5)
 (6)
(6)
 (7)
(7)
3.3 Technical Route
The main steps in the
technical roadmap are shown in Figure 1. First, the in
situ spring phenological observation data of the eight woody plants from
1963?C2015 were obtained from 45 sites in CPON. Second, three models of
spring phenology were established from the
|
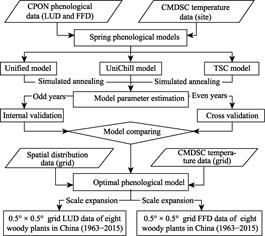
Figure
1 Technical route to develop spring
phenology grid data for eight woody plants in China
|
spatial?Ctemporal
phenophase and corresponding temperature data, and the parameters were estimated
using the simulated annealing algorithm.[16] Next, the goodness of
fit (r2) and root mean square error (RMSE) of the three
models were compared by both internal and cross- validation to select the
optimal model. Finally, the spring phenology 0.5?? ?? 0.5?? grid data of the eight
woody plants in China were developed by simulation and scale expansion from
temperature grid data and spatial distribution grid data.
4 Results and Validation
4.1 Data Composition
The grid data set of spring
phenology consists of three groups of files: header file, phenophase, and
spatial distribution. The naming format, data description, data format, file
number, and data volume of data files are shown in Table 2.
(1) Header file contains grid
data header information of the species phenophase and spatial distribution.
(2) Phenophase contains LUD and FFD folders, each of
which consists of eight species subfolders. Each species subfolder contains 106
phenophase files from 1963 to 2015. The data files are stored in ARCGIS ASCII
and GEOTIFF formats. By copying the grid data header file in front of each
ASCII phenophase file, it can be converted into a visual grid format using the
??ASCII to Raster?? tool in ArcMap.
(3) Spatial distribution contains the actual
distribution grid of each species.[4] The phenophase data outside
the distribution range need to be masked by the user. Data files are stored in
ARCGIS ASCII and GEOTIFF formats, which can also be transformed into visual
GRID format in ArcMap after copying header files.
Table 2 Short form of the spring phenological grid data set of eight typical
deciduous broad-leaved woody plants in the warm temperate zone of China
(1963?C2015)
|
Main files
|
Naming
|
Description
|
Format
|
File number
|
Data volume
|
|
Header file
|
Headfile.txt
|
line 1: column number 64
line 2: row number 36
line 3: lower-left corner??s
longitude 72??E
line 4: lower-left corner??s
latitude 18??N
line 5: spatial resolution
0.5??
line 6: null value 999
|
TXT
|
1
|
1KB
|
|
Phenophase
|
Phenophase_
species_year.txt
|
Phenophase: day of year
No data value: 999
projection: WGS84
|
ARCGIS ASCII
GEOTIFF
|
848
848
|
73.8MB
|
|
Spatial
distribution
|
Spatial_species.txt
|
Distributed value: 1
Undistributed value: 999
projection: WGS84
|
ARCGIS ASCII
GEOTIFF
|
8
8
|
0.7MB
|
4.2 Data Products
(1)
Products
of leaf unfolding date data
The above methods and steps were used to calculate the
average LUD of each species from 1963 to 2015, as shown in Figure 2. According
to the spatial distribution pattern, the LUD of each species differentiated by
latitude and altitude, arriving earlier in the southeast and later in the
northwest of the distribution. In terms of temporal distribution, the first species
with leaf unfolding was Armeniaca vulgaris (Figure 2g), which was
followed by Salix babylonica, Robinia pseudoacacia, Ulmus pumila, Fraxinus
chinensis, Morus alba, and
Cercis chinensis, with Albizia julibrissin the last species
with leaf unfolding (Figure 2d). A linear regress between LUD and year was used
to determine the trend of LUD. The results indicated that the LUD of each
species advanced from 1963 to 2015 (Table 3), with an average trend of 0.9?C3.4
days decade−1. Specifically,
in 83.1%?C99.7% of the cells the LUD were advanced, whereas in 22.0%?C79.8% of
the cells the advance were significant (p<0.05).
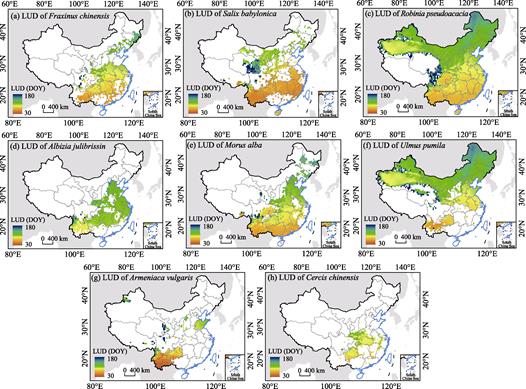
Figure 2 Average leaf unfolding date
(LUD) of eight typical deciduous broad-leaf woody plants in the warm temperate
zone of China from 1963 to 2015. Panels (a)?C(h)
represents mean LUD of each species. DOY represents day of year
refer to a Julian calendar.
(2) Products of first flowering data
Similarly, the FFD of the eight plants from 1963 to
2015 was calculated, and the simulation results are shown in Figure 3. According
to the spatial distribution pattern, for all species, the latitudinal
differentiation of the FFD was less than that of the LUD. Albizia julibrissin
(Figure 3d) and Cercis chinensis (Figure 3h) showed little spatial
difference, whereas the other species showed distinct differences. In terms of
temporal distribution, the sequence of the FFD for each species in the same
area varied. Ulmus pumila (Figure 3f) and Armeniaca vulgaris
(Figure 3g) had the earliest FFD, whereas Robinia pseudoacacia and Albizia
julibrissin had the latest. A linear regress between FFD and year was used
to determine the trend of FFD. The results of trend analysis indicated that the
FFD of the eight woody plants in China was also earlier in the past 50 years,
with an average advance of 0.7?C3.3 days decade−1. In the grid,
77.1%?C97.7% of the cells of the FFD were advanced, whereas 32.5%?C 79.7% of the
cells were significant (p<0.05).
Table
3 Statistics
on the shifting trend in the spring phenophase of eight typical deciduous
broad-leaved woody plants in China from 1963 to 2015
|
Phenophase
|
Species
|
Trend (d/10a)
|
Advanced
|
Delayed
|
Significant
delayed
|
Significant
advanced
|
|
LUD
|
Fraxinus chinensis
|
-1.0
|
90.3%
|
9.7%
|
43.7%
|
0.5%
|
|
Salix
babylonica
|
-1.1
|
93.3%
|
6.7%
|
48.0%
|
2.6%
|
|
Robinia
pseudoacacia
|
-1.1
|
94.1%
|
5.9%
|
62.4%
|
0.4%
|
|
Albizia
julibrissin
|
-3.3
|
99.7%
|
0.3%
|
66.6%
|
0.0%
|
|
Morus
alba
|
-0.9
|
86.6%
|
13.4%
|
43.6%
|
0.3%
|
|
Ulmus
pumila
|
-3.4
|
97.5%
|
2.5%
|
79.8%
|
0.3%
|
|
Armeniaca
vulgaris
|
-1.4
|
98.1%
|
1.9%
|
64.3%
|
0.0%
|
|
Cercis
chinensis
|
-0.6
|
83.1%
|
16.9%
|
22.0%
|
2.4%
|
|
FFD
|
Fraxinus
chinensis
|
-1.2
|
77.1%
|
22.9%
|
37.1%
|
0.4%
|
|
Salix
babylonica
|
-0.7
|
78.8%
|
21.2%
|
44.2%
|
6.5%
|
|
Robinia
pseudoacacia
|
-3.3
|
97.7%
|
2.3%
|
79.7%
|
0.3%
|
|
Albizia
julibrissin
|
-1.1
|
96.2%
|
3.8%
|
64.8%
|
1.5%
|
|
Morus
alba
|
-1.7
|
94.7%
|
5.3%
|
58.5%
|
0.4%
|
|
Ulmus
pumila
|
-1.8
|
94.4%
|
5.6%
|
65.1%
|
0.8%
|
|
Armeniaca
vulgaris
|
-1.0
|
89.2%
|
10.8%
|
47.7%
|
1.1%
|
|
Cercis
chinensis
|
-0.8
|
89.3%
|
10.7%
|
32.5%
|
0.7%
|
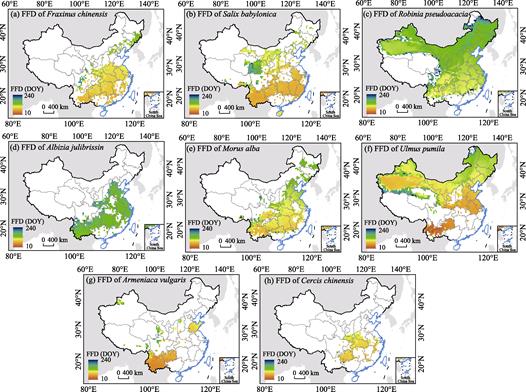
Figure
3 Average
first flowering date (FFD) of eight typical deciduous broad-leaf woody plants
in the warm temperate zone of China from 1963 to 2015. Panels (a)?C(h) represents mean FFD of each species. DOY represents day of year refer to a Julian calendar.
4.3 Data validation
(1) Leaf unfolding date validation
Internal and cross-validation
methods were used to verify the reliability of the LUD (Figure 4). According to
internal verification results, the fit of all three phenological models to the
data was good. The r2 values of the three models of the eight
species were greater than 0.81, except for Albizia julibrissin (r2
= 0.47, 0.51, 0.45) and Cercis chinensis (r2 =
0.51, 0.59, 0.53). For most species, the UniChill model had a relatively better
fit to the LUD data, with RMSE values ranging from 5.07 to 9.90 days. The TSC model
had the best fit for Salix babylonica and Robinia pseudoacacia, with RMSE val- ues of 5.27?C8.36
days. The Unified model was a relatively poor fit to data of all species. According to the cross-validation results, the simulations of the LUD by the
UniChill and TSC models were similar for most species. Except for Albizia
julibrissin (r2 = 0.50 and 0.46, respectively) and Cercis
chinensis (r2 = 0.60 and 0.64, respectively), the r2
values of other species reached 0.84?C0.91, with RMSE values of 5.09?C11.04 days.
The simulation results of the Unified models were relatively poor, with RMSE
values ranging from 5.30 to 12.56 days. Overall, the cross-validation results indicated
that the
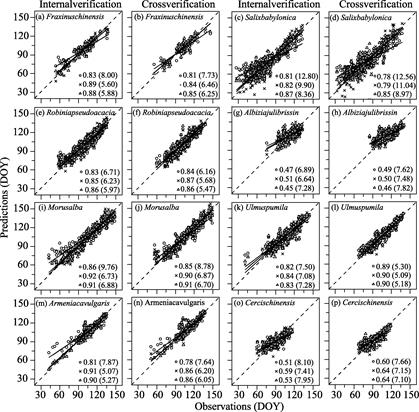
Figure 4 Internal and cross-validation of the
simulation results of the leaf unfolding date (LUD) of eight species by three
phenological models. Panels (a)?C(p) represents internal and
cross-validation on LUD of each species. DOY represents day of year
refer to a Julian calendar.
Note: The circle, cross, and
triangle represent the simulation results of the Unified, UniChill, and TSC
models, respectively. Solid lines are linear regression curves fit to observed
and predicted values. The number after the symbol and the number in parentheses
represent the r2 and root mean square error, respectively, of
the model. The root mean square minimum value represents the simulation result
of the optimal phenological model.
simulation
error of the optimal phenological model of the LUD of each species was
5.09?C8.97 days.
(2) First flowering date validation
The results of
the FFD were similar to those of the LUD. Internal verification showed that the
fit of the models to the FFD of the eight woody plants differed (Figure 5).
Except for Albizia julibrissin (r2 = 0.45), the
average r2 of the optimal model was 0.68?C0.92. The UniChill
model had the best fit for the FFD of most species, with RMSE
values ranging from 5.05 to 11.34 days. The fit of the TSC model was better
than that of the other models for Salix babylonica and Robinia
pseudoacacia, with RMSE values ranging from 5.26?C13.48 days. According to
cross-validation results, the simulations of the different models were obviously
different. The simulations of the FFD of the UniChill model were more accurate
for half of the study species, and RMSE
values were 4.78?C8.38 days. The TSC model was the most suitable for Salix
babylonica and Robinia pseudoacacia, whereas the Unified model was
the best for Fraxinus chinensis and Albizia julibrissin. The
cross-validation results indicated that the simulation by the optimal
phenological model for the FFD was inferior to the simulation by the optimal
phenological model for the LUD, with an error of 4.78?C12.35 days.
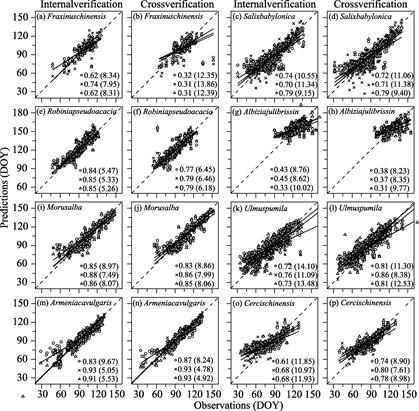
Figure 5 Internal and cross-validation of the
simulation results of the first flowering date (FFD) of eight species by three
phenological models. Panels (a)?C(p) represents internal and cross-validation on
FFD of each species. DOY represents day of year refer to a Julian calendar.
Note:
The circle, cross, and triangle represent the simulation results of the
Unified, UniChill, and TSC models, respectively. Solid lines are linear
regression curves fit to observed and predicted values. The number after the
symbol and the number in parentheses represent the r2 and
root mean square error, respectively, of the model. The root mean square
minimum value represents the
simulation result of the optimal phenological model.
5 Discussion and Conclusion
In this paper,
in situ phenological data from the China Phenological Observation Network from
1963?C2015 were used with three common spring phenological models to develop a
spring phenological grid data set of eight typical deciduous broad-leaved woody
plants in the warm temperate zone of China. The data set provides grid data of
the LUD and the FFD of the eight species. The temporal and spatial resolution
are one year and 0.5?? ?? 0.5??, respectively. For each species, the mean
simulation error was approximately 5?C9 days for the LUD and approximately 5-12
days for the FFD. The data set represents the spatial?Ctemporal patterns of
plant phenology in China over the past 50 years, which can provide basic data
for many areas of research, such as global change, meteorology, ecology,
natural resources, the environment, tourism, and human health.
Author Contributions
Dai,
J. H. was responsible for the overall design and development of the dataset.
Hu, Z. and Dong, X. Y. collected and processed spring phenological data. Wang,
H. J. and Tao, Z. X. designed the models and the algorithm. Zhu, M. Y. and Hu,
Z. performed data verification. Zhu, M. Y. and Dai, J. H. wrote the dataset
papers.
References
[1]
Lieth H. Phenology and
Seasonality Modeling [J]. Ecological Studies, 1974, 120(6): 461.
[2]
Richardson A. D., Keenan T. F.,
Migliavacca M., et al. Climate change, phenology, and phenological control
of vegetation feedbacks to the climate system [J]. Agricultural and Forest
Meteorology, 2013, 169: 156?C173.
[3]
Piao S. L., Liu Q., Chen A. P.,
et al. Plant phenology and global climate change: current progresses and
challenges [J]. Global Change Biology, 2019, 25: 1922?C1940.
[4]
Ge Q. S., Dai J. H., Wang H. J.
The gridded dataset of spring phenology of Fraxinus chinensis in China from
1952 to 2007 [DB/OL]. Global Change Research Data Publishing &
Repository, 2014. DOI: 10.3974/geodb.2014.01.09.V1.
[5]
Ge, Q. S., Wang, H. J.,
Rutishauser, T., et al. Phenological
response to climate change in China: a meta- analysis [J]. Global Change
Biology, 2015, 21(1): 265?C274.
[6]
Dai, J. H., Wang, H. J., Ge, Q.
S. The spatial pattern of leaf phenology and its response to climate change in
China [J]. International Journal of Biometeorology, 2014, 58(4): 521?C528.
[7]
Dai, J. H., Zhu, M. Y., Wang,
H. J., et al. Spring phenological grid data set of typical deciduous
broad-leaved woody plants in the warm temperate zone of China [DB/OL]. Global
Change Research Data Publishing & Repository, 2019. DOI:
10.3974/geodb.2019.06.04.V1.
[8]
Change Research Data Publishing
& Repository. Data sharing policy for scientific research on global change
[OL]. DOI: 10.3974/dp.policy.2014.05 (updated 2017).
[9]
Fang, J. Y., Wang, Z. H., Tang,
Z. Y. Altas of woody plants in China: distribution and climate [M]. Beijing: Higher
Education Press, 2009.
[10]
Wang, H. J., Dai, J. H., Ge, Q.
S. The spatiotemporal characteristics of spring phenophase changes of Fraxinus
chinensis in China from 1952 to 2007 [J]. Science China-Earth Sciences,
2012, 55(6): 991?C1000.
[11]
Chuine, I. A unified model for
budburst of trees [J]. Journal of Theoretical Biology, 2000, 207(3): 337?C347.
[12]
Ge, Q. S., Wang, H. J., Dai, J.
H. Simulating changes in the leaf unfolding time of 20 plant species in China
over the twenty-first century [J]. International Journal of Biometeorology,
2014, 58(4): 473?C484.
[13]
Tao, Z. X. Simulation of the distributions
of five widespread tree species in China under the influence of phenological
changes [D]. Beijing: University of
Chinese Academy of Sciences, 2018.
[14]
Hunter, A. F., Lechowicz, M. J.
Predicting the timing of budburst in temperate trees [J]. Journal of Applied
Ecology, 1992, 29(3): 597?C604.
[15]
Wang, H. J., Ge, Q. S.,
Rutishauser, T., et al.
Parameterization of temperature sensitivity of spring phenology and its
application in explaining diverse phenological responses to temperature change
[J]. Scientific Reports, 2015, 5(1): 8833.
[16]
Chuine, I., Cour, P., Rousseau,
D. D. Fitting models predicting dates of flowering of temperate-zone trees
using simulated annealing [J]. Plant Cell and Environment, 1998, 21(5):
455?C466.