Monthly Drought Index (1951-2016) and
8-day Frequency Soil Moisture (2007-2016)
Dataset in Southwest China
Hu, G. C.1 Zhou,
J.2 Lu, J.1 Zheng, C. L.1 Jia, L.1*
1. The
State Key Laboratory of Remote Sensing Science, Aerospace Information Research
Institute, Chinese Academy of Sciences, Beijing 100101, China;
2. The College
of Urban and Environmental Science, Central China Normal University, Wuhan
430079, China
Abstract: The
self-calibrating Palmer Drought Severity Index (scPDSI) dataset was developed
based on the concept of water balance, and represents an appropriate index for
comparing the relative spatiotemporal variability of the dryness/wetness across
southwest of China impacted by climate warming. The temporal variation
characteristics of the dryness/wetness in southwest of China and the response
of soil moisture were analyzed based on the scPDSI dataset and the European
Space Agency (ESA) Climate Change Initiative (CCI) remotely sensed soil
moisture. The dataset is consisted of the following data in southwest of China:
(1) monthly scPDSI during 1951?C2016; (2) 8-day frequency active microwave
remote sensing soil moisture data during 2007?C2016; and (3) 8-day frequency standardized
CCI soil moisture data during 2007?C2016. The data spatial resolution is 0.5??.
The dataset consists of two data files and are archived in . xls and. tif data
formats with data size of 98 KB (compressed to one single data file with 31.7
KB).
Keywords: drought severity index; soil moisture;
dryness/wetness; Southwest China
Dataset Availability Statement:
The dataset
supporting this paper was published and is accessible through the Digital Journal of Global Change Data
Repository at: https://doi.org/10.3974/geodb.2020.04.17.V1.
1 Introduction
Southwest
China includes provinces of Sichuan, Yunnan, Guizhou, Guangxi Zhuang autonomous
region and Chongqing municipality with a total land area of 1,362,300 km2. Southwest China is affected by the East Asian monsoon and the
South Asia tropical monsoon, and the climate types are diverse. The regional
climate is also greatly affected by local factors, e.g. the topography. As the
global climate is significantly warming, the regional climate tends to be warm
and dry in Southwest China. In the context of significant global warming,
droughts in southwest of China have been frequent in recent years, such as the
severe drought in Sichuan and Chongqing in the summer of 2006, the drought in southwest
of China in the autumn of 2009 to the spring of 2010, and the mid summer and
autumn drought across southwest of China in 2011.
With the development of meteorology and related disciplines, dozens of
quantitative indicators that reflect changes in climate dryness/wetness have
been developed in climate change and drought monitoring studies, such as the
single factor indices that rely only on precipitation, the indices that combine
precipitation and temperature factors, and the index based on satellite remote
sensing technology, etc. Commonly used indices include Precipitation Anomaly
Percentage (PAP), Standardized Precipitation Index (SPI), Standardized
Precipitation Evapotranspiration Index (SPEI)[1], and Palmer Drought Severity Index
(PDSI), etc. The PAP and SPI are mainly based on long-term series of
precipitation data, and have certain limitations in reflecting the change of dryness/wetness
conditions under the background of climate warming. The SPEI and PDSI consider
the effects of precipitation and evapotranspiration on water balance, and the
PDSI comprehensively reflects the effects of precipitation and evapotranspiration
based on the soil water balance equation. The self-calibrating PDSI (scPDSI)
with explicit physical meaning was derived through the continuous correction
and improvement[2]. Therefore, the temporal variation of dryness/wetness
over southwest of China under the background of climate warming was analyzed
using the scPDSI dataset in 1951?C2016 , and the response of surface soil
moisture was analyzed using the standardized European Space Agency (ESA)
Climate Change Initiative (CCI) soil moisture dataset in 2007?C2016, to provide
a scientific basis for systematic analysis of the spatiotemporal evolution of
climate in southwest of China and for the monitoring and assessment of drought
disasters.
2 Metadata of the Dataset
The
metadata of the ??Monthly drought index (1951-2016) and 8-day frequency soil moisture (2007-2016) dataset in southwest of China??[3] is summarized in Table 1. It includes the dataset full name, short
name, authors, year of the dataset, temporal resolution, spatial resolution, data
format, data size, data files, data publisher, and data sharing policy, etc.
3 Methods
3.1 Data Collection
The
PDSI is a commonly used indicator to reflect changes in climate
dryness/wetness, and is widely used in hydrology, meteorology, and agriculture.
The PDSI is based on the principle of soil water balance to characterize the
prolonged water deficiency (or excess) situation in which the actual water
supply is continuously less (or more) than the local water supply at a normal
level over a period of time. The PDSI is a function of water anomaly (deficiency
or excess) and a duration index. The water balance is calculated by considering
the difference of water supply and demand in the previous period, and can
reflect large-scale soil moisture dynamics. Due to the influence of the
previous duration index, the time scale of climate change in dryness/wetness
characterized by PDSI is usually 9?C12 months, which can reduce the short-term
local climate fluctuations. The PDSI is related to local climate background,
whereas the scPDSI corrects the climate weighting factor and duration index,
overcomes the limitations of PDSI to account for water deficiency (or excess)
in different regions and at different times[2]. After standardization, the scPDSI values generally vary between ?C5
(Drought) and +5 (Moist) (Table 2).
Table
1 Metadata summary of the ??Monthly drought
index (1951-2016) and 8-day
frequency soil moisture (2007-2016)
dataset in Southwest China??
|
Items
|
Description
|
|
Dataset full name
|
Monthly drought
index (1951?C2016) and 8-day frequency soil moisture (2007?C2016) dataset in
Southwest China
|
|
Dataset short
name
|
scPDSI(1951-2016)_CCI-SoilMoisture(2007-2016)_SW_China
|
|
Authors
|
Hu, G. C.
L-6160-2016, Aerospace Information Research Institute, Chinese Academy of Sciences,
hugc@aircas.ac.cn
Zhou, J.
G-6760-2011, College of Urban and Environmental Science, Central China Normal
University, zhou.j@mail.ccnu.edu.cn
Lu, J.
L-4754-2016, Aerospace Information Research Institute, Chinese Academy of Sciences,
lujing@aircas.ac.cn
Zheng, C. L.
L-6182-2016, Aerospace Information Research Institute, Chinese Academy of Sciences,
zhengcl@aircas.ac.cn
Jia, L.
I-1457-2014, Aerospace Information Research Institute, Chinese Academy of Sciences,
jiali@aircas.ac.cn
|
|
Geographical region
|
Southwest
of China: 21??9¢N?C34??19¢N, 97??20¢E?C112??2¢E
|
|
Year
|
1951?C2016
|
|
Temporal resolution
|
Monthly, 8-day
|
|
Spatial resolution
|
0.5??
|
|
Data format
|
.tif, .xls
|
|
|
|
Data size
|
98 KB
|
|
|
|
Data files
|
(1)
scPDSI(1951-2016)_CCI-SoilMoisture(2007-2016)_SW_China (Table 1: monthly
scPDSI during 1951?C2016)
(2)
scPDSI(1951-2016)_CCI-SoilMoisture(2007-2016)_SW_China (Tble 2: 8-day
frequency active microwave remote sensing soil moisture data during 2007?C2016)
(3)
scPDSI_1951-2016_interannual_slope_SW_China (8-day frequency standardized CCI
soil moisture data during 2007?C2016)
|
|
Foundation(s)
|
Ministry of
Science and Technology of P. R. China (2017YFD0300402); National Natural
Science Foundation of China (41701495)
|
|
Data publisher
|
Global Change Research Data Publishing & Repository, http://www.geodoi.ac.cn
|
|
Address
|
No. 11A, Datun
Road, Chaoyang District, Beijing 100101, China
|
|
Data
sharing policy
|
Data from the Global Change Research Data Publishing
&Repository includes metadata, datasets (in the Digital Journal of Global
Change Data Repository), and publications (in the Journal of Global
Change Data & Discovery). Data sharing policy includes:
(1) Data are openly available and can be free downloaded via
the Internet; (2) End users are encouraged to use Data subject
to citation; (3) Users, who are by definition also value-added service providers,
are welcome to redistribute Data subject to written permission
from the GCdataPR Editorial Office and the issuance of a Data redistribution
license; and (4) If Data are used to compile new datasets, the
??ten per cent principal?? should be followed such that Data records
utilized should not surpass 10% of the new dataset contents, while sources
should be clearly noted in suitable places in the new dataset[4]
|
|
Communication and searchable system
|
DOI, DCI, CSCD, WDS/ISC, GEOSS, China GEOSS, Crossref
|
The global scPDSI
dataset used in the study was derived from the Climatic Research Unit (CRU),
University of East Anglia[5]. The time range
covers 1901?C2016 at a 0.5??spatial resolution and a 1 month temporal resolution.
The precipitation and potential evapotranspiration data for the scPDSI water
balance model were derived from the version 3.25 CRU time-series (TS) global
high-resolution grids of monthly climatic observations[6]. The potential evapotranspiration was estimated on monthly basis
based on the Penman?CMonteith equation taking accounts of both temperature and
radiation. The CRU scPDSI data has good responsiveness to changes in climate
dryness/wetness and has been used for the monitoring and assessment of global
droughts[7]. The CRU TS meteorological
observations were derived based on the interpolation of meteorological station
observations. Since the more complete station observations in China began in
the early 1950s, in this study the 1951?C2016 CRU scPDSI dataset were used for
the analysis of temporal variation of dryness/wetness over southwest of China.
|
Table 2 Levels of Dryness/Wetness Defined by
Ranges of self-calibrating Palmer Drought Severity Index (scPDSI)
|
|
scPDSI
|
Dryness/Wetness
|
|
>
4
|
Extremely Moist
|
|
3?C4
|
Very Moist
|
|
2?C3
|
Unusually Moist
|
|
1?C2
|
Slightly Moist
|
|
?C1?C1
|
Near
Normal
|
|
?C2?C
?C1
|
Pre-Drought
|
|
?C3?C
?C2
|
Moderate Drought
|
|
?C4?C
?C3
|
Severe Drought
|
|
<
?C4
|
Extreme Drought
|
The global satellite observed ESA CCI soil moisture product combines
various single-sensor active and passive microwave soil moisture products into
three harmonised products: ACTIVE, PASSIVE and COMBINED[8]. The
version 4.2 ESA CCI soil moisture data has a spatiotemporal resolution of
0.25??/1-d and spans a long-time range of 1979?C2016. For southwest of China with
a humid climate and dense vegetation coverage, the active microwave soil
moisture data is better than the passive microwave data, and there are many
gaps in soil moisture retrieved by passive microwave remote sensing in southwest
of China. Therefore, in this study the ESA CCI active microwave soil moisture
data since 2007 (blending the Advanced SCATterometer (ASCAT) data) was
standardized and used to analyze the response of soil moisture to temporal
variation of climate dryness/wetness.
3.2 Data Processing
The linear trend
analysis was conducted for the annual-average scPDSI within the 1951?C2016 time
periods. The trend of inter-annual variation
of dryness/wetness, i.e. inter-annual
change rate of scPDSI, was derived based on the least squares method for
the past 66 years. The
positive linear trend of scPDSI indicates that the
scPDSI is gradually increasing, and the climate tends to be moister. The negative
linear trend of scPDSI indicates that the scPDSI is gradually decreasing, and the
climate tends to be more arid.
The ESA CCI active microwave remotely sensed
soil moisture is dimensionless, with values ranging from 0% to 100%. In order
to compare the scPDSI and ESA CCI soil moisture, the ESA CCI soil moisture was
standardized (Equation 1) with the same range of values as scPDSI.
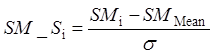 (1)
(1)
where
SM_Si (dimensionless) is
the standardized ESA CCI soil moisture (i
is 2007, 2008, ..., 2016), SMi
(%) is the original ESA CCI soil moisture,
SMMean (%) is the average multi-annual soil moisture for
2007?C2016, and s (%) is the standard deviation of the SMi time series.
4 Data Results and Validation
4.1 Data Composition
The dataset is
consisted of the following data: (1) monthly scPDSI during 1951?C2016; (2) 8-day
frequency active microwave remote sensing soil moisture data during 2007?C2016;
and (3) 8-day frequency standardized CCI soil moisture data during 2007?C2016.
The spatial data resolution is 0.5??. The dataset consists of two data files and
archived in .xls and .tif formats with data size of 98 KB (compressed to one single
data file with 31.7 KB).
4.2 Data Results and Analysis
4.2.1 Inter-annual Variation of
Dryness/Wetness and the Response of Soil Moisture
The
spatial distribution characteristics of the inter-annual variation trend of the
scPDSI across southwest of China from 1951 to 2016 are shown in Figure 1. Most
of the southwest of China has been in aridification trend in the past 66 years,
and the progressive aridification trend is obvious in the border areas of
Sichuan, Guizhou and Yunnan. The Tibetan Plateau in northwestern Sichuan showed
a trend of humidification.

Figure 1 Pixel-based dryness/wetness trends
across southwest of China from 1951 to 2016
The regional
average of the annual scPDSI in southwest of China from 1951 to 2016 is shown
in Figure 2. In the second half of the 20th century, the climate
across southwest of China changed alternately, but the overall inter-annual
trend was relatively stable. Since the 21st century, the climatic
aridification trend has been very obvious, especially for the long-term
continuous drought conditions in 2005?C2007 and 2009?C2013, mainly due to the
lack of the intersection of north?Csouth airflow in southwest of China, and due
to the decreased water vapor transport from the Bay of Bengal and the South
China Sea to southwest of China. In addition, when the drought occurred, the
arid climate continued to spread due to the corresponding abnormal convective
downdrafts, leading to less rising motion conditions to form precipitation.
The regional average of the annual scPDSI
and the standardized ESA CCI soil moisture in southwest of China from 2007 to
2016 are shown in Figure 3. The overall inter-annual trend of scPDSI and standardized CCI
soil moisture is consistent, indicating the transition from the early arid
climate to the later humid climate. Since the time scale represented by the
scPDSI is usually 9?C12 months, the inter-annual variation is relatively flat
and lagging, while the temporal variation of CCI surface soil moisture (in the
upper 10 cm of soil) is more sensitive. For the continuous drought conditions
in southwest of China from the fall of 2009 to the spring of 2010, scPDSI
reflected the most arid climate in 2010, while the indication on the CCI soil
moisture was not obvious, and the details of the local climate change will be
analyzed by the seasonal changes in the next section.
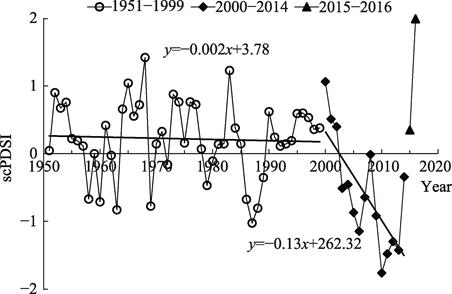
Figure 2 The inter-annual variations of the
dryness/wetness indicated by scPDSI in Southwest
China from 1951 to 2016
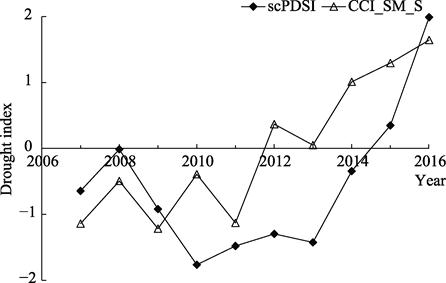
Figure 3 The inter-annual variations of the
dryness/wetness indicated by scPDSI and standardized CCI soil moisture
(CCI_SM_S) in southwest of China from 2007 to 2016
4.2.2 Seasonal Variation of Dryness/Wetness and the Response of Soil Moisture
The regional average
of monthly scPDSI and 8 d averaged CCI soil moisture in southwest of China
during the arid climate in 2009?C2011 and the humid climate in 2014?C2016 are
respectively shown in Figure 4 and Figure 5. The multi-year average of CCI soil
moisture is the average of 2007?C2016 for a certain period at 8-day interval of
the year to derive the standardized soil moisture. In 2009?C2011, scPDSI
reflected two extreme drought events, i.e., from autumn 2009 to spring 2010 and
summer 2011. The CCI soil moisture in the corresponding period was
significantly lower than the multi-year average. The minimum standardized CCI
soil moisture reached ?C2, and the trough shape was consistent with scPDSI. In
the second half of 2010, the drought eased and the scPDSI increased slowly, while
the standardized CCI soil moisture increased
rapidly to near 0, which was mainly determined by the different drought
scales represented by these two indicators. For drought, it is characterized by
multi-scale phenomenon. The drought scale
represented by scPDSI is usually 9?C12 months, reflecting the long-term
hydrological drought, whereas the standardized CCI soil moisture can be used to
evaluate the short-term meteorological drought and agricultural drought.
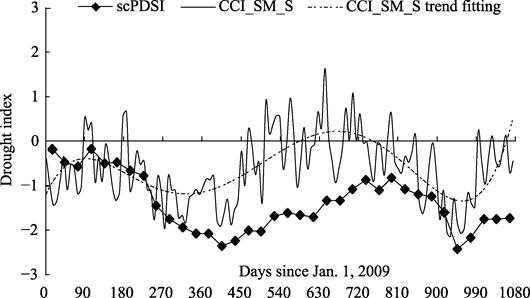
Figure 4 Seasonal variations of the dryness/wetness
indicated by scPDSI and standardized CCI soil moisture (CCI_SM_S) in Southwest
of China from 2009 to 2011
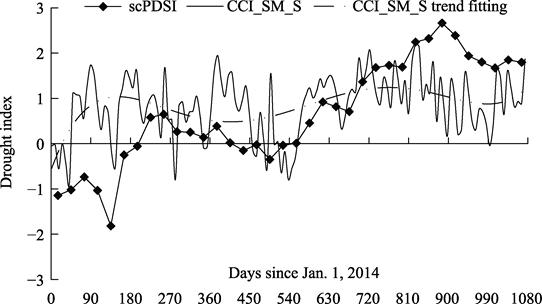
Figure 5 Seasonal variations of the
dryness/wetness indicated by scPDSI and standardized CCI soil moisture
(CCI_SM_S) in Southwest of China from 2014 to 2016
In 2014?C2016 when the Super El Niño event
occurred, scPDSI gradually turned from negative to positive, and the climate
was moist. From the summer of 2015 to 2016, the climate was characterized by
unusual moist, and the CCI soil moisture in the corresponding period was
significantly higher than the multi-year average, the standardized CCI soil moisture
is greater than 0. Therefore, the CCI active microwave soil moisture can better
reflect the change of climate dryness and wetness, and also realize the
large-scale indirect validation of remotely sensed soil moisture with a coarse
resolution. It should be noted that the response of standardized CCI soil
moisture to extreme precipitation events is not sensitive enough, and the peak
shape in summer 2016 is lower than that of scPDSI. The main reason is that a
large amount of precipitation forms surface runoff or infiltration to recharge
groundwater during extreme precipitation events, so the change of surface soil
moisture is relatively gentle.
4.3 Data Validation
The wetness index
calculated from meteorological observations during 1961?C2011 show that the
climate in southwest of China has a trend of ??warm and dry?? in recent 50 years,
and the trend has been further intensified since the 21st century[9-10], which is consistent with the characteristics of climate change
reflected by the scPDSI. In addition, based on the soil moisture simulated by Noah
land surface model from the Global Land Data Assimilation System (GLDAS), the
correlation analysis of soil moisture with precipitation and air temperature
shows that the correlation between surface soil moisture and temperature in southwest
of China is higher than that of precipitation. The annual precipitation in southwest
of China showed no significant increase trend from 1979 to 2017, and the annual
average temperature showed a significant upward trend (i.e. an increasing trend
in potential evapotranspiration), while the surface soil moisture showed a
significant decrease trend[11]. The response of
GLDAS soil moisture to the characteristics of warm and dry climate change in southwest
of China, is consistent with the response of CCI remotely sensed surface soil
moisture to climate change.
5 Discussion and Conclusion
The scPDSI has good
responsiveness to the changes of climate dryness and wetness in southwest of
China from 1951 to 2016 under the background of climate warming. The scPDSI is
usually established based on meteorological data. With the time series of remotely
sensed precipitation products gradually extend and accumulate, they can be applied
to the establishment of the drought indicators based on precipitation[12]. In addition, the Vegetation Health Index (VHI) and Normalized Drought
Anomaly Index (NDAI) established based on multi-source remote sensing data,
usually have higher spatial resolution and can indirectly reflect the change of
surface dryness and wetness[13?C14].
The temporal variation of climate
dryness/wetness over southwest of China under the background of climate warming
and the response of surface soil moisture were analyzed based on the scPDSI
(1951?C2016) and ESA CCI active microwave soil moisture data (2007?C2016), and
the main conclusions are as follows:
(1) scPDSI comprehensively considers the
two factors affecting water deficiency (or excess) by precipitation and
evapotranspiration, and has good responsiveness to climate change in
dryness/wetness over southwest of China under the background of climate warming.
The active microwave soil moisture can better reflect the change of climate
dryness and wetness represented by scPDSI, especially the response to drought
events is more sensitive than that to extreme precipitation events, and also
realize the large-scale indirect validation of remotely sensed soil moisture
with a coarse resolution.
(2) Most area of the southwest of China is
in acidification trend, especially since the 21st century. The
climatic aridification trend is very obvious, and there are long-term extreme
arid climate with extensive droughts in 2005?C2007 and 2009?C2013.
(3) In the context of significant climate
warming, extreme meteorological events in southwest of China have occurred
frequently in recent years. 2010 and 2016 is respectively the most arid year
and the wettest year in the past 66 years. It is necessary to further improve
the monitoring and predictive capabilities for extreme drought events and
extreme precipitation events over southwest of China.
Author Contributions
Jia, L. designed the algorithms of dataset. Zhou, J. and Lu, J. contributed
to the data processing of scPDSI and CCI soil moisture. Hu, G. C. and Zheng, C.
L. contributed to the data analysis. Jia, L. and Hu, G. C. wrote the data paper.
References
[1]
Vicente-Serrano, S.
M., Beguer??a, S., L??pez-Moreno, J. I. A multiscalar drought index sensitive to
global warming: the standardized precipitation evapotranspiration index [J]. Journal of Climate, 2010, 23(7):
1696?C1718.
[2]
Wells, N., Goddard,
S., Hayes, M. J. A self-calibrating palmer drought severity index [J]. Journal of Climate, 2004, 17(12): 2335?C2351.
[3]
Hu, G. C., Zhou,
J., Lu, J., et al. Monthly drought index (1951-2016)
and 8-day frequency soil moisture (2007?C2016) dataset in southwest of China [J/DB/OL].
Digital Journal of Global Change Data
Repository, 2020. https://doi.org/10.3974/geodb.2020.04.17.V1.
[4]
GCdataPR Editorial
Office. GCdataPR data sharing policy [OL].
https://doi.org/10.3974/dp.policy.2014.05 (Updated 2017).
[5]
van der Schrier,
G., Barichivich, J., Briffa, K. R., et al.
A scPDSI-based global data set of dry and wet
spells for 1901?C2009 [J]. Journal of
Geophysical Research (Atmospheres),
2013, 118(10): 4025?C4048.
[6]
Harris, I., Jones,
P. D., Osborn, T. J., et al. Updated high-resolution grids of monthly climatic observations??the
CRU TS3.10 dataset [J]. International
Journal of Climatology, 2014, 34(3): 623?C642.
[7]
Osborn, T. J.,
Barichivich, J., Harris, I., et al.
Monitoring global drought using the self-calibrating Palmer Drought Severity
Index [in ??State of the Climate in 2016?? [J]. Bulletin of the American Meteorological Society, 2017, 98(8): S32?CS33.
[8]
Liu, Y. Y., Dorigo,
W. A., Parinussa, R. M., et al.
Trend-preserving blending of passive and active microwave soil moisture
retrievals [J]. Remote Sensing of
Environment, 2012, 123: 280?C297.
[9]
Su, X. C., Wang,
L., Li, Q. L., et al. Study of surface dry and wet conditions in southwest of China in
recent 50 years [J]. Journal of Natural
Resources, 2014, 29(1): 104?C116.
[10]
Wang, Y., Liu, P.
X., Cao, L. G., et al.
Characteristics of Southwestern China dry-wet condition based on wetness index
in 1960-2011 [J]. Journal of Natural Resources, 2014, 29(5): 830?C838.
[11]
Deng, Y. H., Wang,
S. J., Bai, X. Y., et al.
Relationship between soil moisture and climate and its memory in southwest of
China [J]. Acta Ecologica Sinica,
2018, 38(24): 8688?C8699.
[12]
Lu, J., Jia, L.,
Menenti, M., et al. Performance of the standardized precipitation index based on the TMPA
and CMORPH precipitation products for drought monitoring in China [J]. IEEE Journal of Selected Topics in Applied
Earth Observations and Remote Sensing, 2018, 11(5): 1387?C1396.
[13]
Jia, L., Hu, G. C.,
Zhou, J., et al. Assessing the
sensitivity of two new indicators of vegetation response to water availability
for drought monitoring [C]. Entekhabi, D., Honda, Y., Sawada, H., et al. (eds.). Proceedings of SPIE Vol.
8524 (Land Surface Remote Sensing). Bellingham: The Society of Photo-Optical
Instrumentation Engineers (SPIE), 2012: 85241A.
[14]
van Hoek, M., Zhou, J., Jia, L., et al. A prototype web-based
analysis platform for drought monitoring and early warning [J]. International Journal of Digital Earth,
2020, 13(7): 817?C831.