The
Boundary Dataset Based on Two Algorithms of the Hierarchical Solar Radiation
Zones in China
Jiang, H. 1,2* Yao, L.1
1. The
State Key Laboratory of Resource and Environmental Information Systems,
Institute of Geographic Sciences and Natural Resources Research, Chinese
Academy of Sciences, Beijing 100101, China;
2. The
State Key Laboratory of Remote Sensing Science, School of Geography, Beijing
Normal University, Beijing 100875, China
Abstract: Solar radiation zoning is the foundation for
guiding solar energy utilization and formulating regional development plans. The
dataset provide the boundaries based on two algorithms for hierarchical solar
radiation zoning in China, including fine boundaries of 5 primary zones and 10
sub-zones. An automatic zoning algorithm based on Gaussian mixture model is employed
to identify solar radiation zones, whose number is adaptively determined by
Bayesian inference. We utilize the ground observations of solar radiation at 98
stations from 2007 to 2020 for Gaussian mixture model fitting, and then introduce
spatially continuous solar radiation products from remote sensing images into
the fitted model to identify the boundaries of adjacent zones. The zoning
results are validated using sunshine-based solar radiation products at 716
weather stations. It is revealed that the zoning algorithm can divide stations
with different solar radiation characteristics into plausible zones with an
accuracy rate of approximately 90%. In addition, most inaccurate stations are
located within the zone rather than near the boundaries, which further proves
the reliability of the used algorithm and identified boundaries.
Keywords: solar radiation; zoning
boundary; Gaussian mixture model; solar energy utilization
DOI: https://doi.org/10.3974/geodp.2023.02.07
CSTR: https://cstr.escience.org.cn/CSTR:20146.14.2023.02.07
Dataset Availability Statement:
The dataset supporting this paper
was published and is accessible through the Digital Journal of Global Change Data Repository
at: https://doi.org/10.3974/geodb.2023.07.07.V1
or https://cstr.escience.org.cn/CSTR:20146.11.2023.07.07.V1.
1 Introduction
Solar
photovoltaic (PV) shows great potential in promoting global carbon neutrality[1]. Due to
the geographical diversity of climate, the power generation efficiency of solar
PV always presents significant spatial differences[2]. Solar radiation zoning is
considered to be the most direct and practical method to gain insight into
regional differences of solar energy, and is the basis for strategic planning
oriented to solar market, site selection of PV power plants and placement of
energy storage facilities[3?C5]. For example, solar radiation
zoning is beneficial for government energy departments to design PV development
roadmaps[6], screen
suitable regions for centralized PV plants[7], put solar facilities in public,
etc.[8].
Climate zones
have been extensively studied worldwide, and researchers have established a
variety of climate zoning systems based on different climate variables and
indices[9]. In China, by taking passive
heat energy utilization of buildings as reference[10, 11], the widely used building climate
zones divide the climate into five major categories: severe cold, cold, hot
summer & cold winter, hot summer & warm winter, and temperate. The
development of bioclimatic map theory has gradually promoted the concept of
bioclimatic zones[10, 12]. Lam et al. (2006) analyzed weather data from
18 typical cities in China and classified the country into nine bioclimatic
zones. Wan et al. (2010) identified 5
bioclimatic zones and 8 subzones in China based on a long-term investigation of
summer and winter heat stress discomfort. In addition to temperature,
environmental factors such as humidity and wind speed are also gradually
included into the zoning process of climates, resulting in more elaborate
climate zones, which however become fragmented and complicated.
There are
relatively few zoning schemes aiming at solar energy use. Traditional solar
radiation zoning is based on the amount of annually cumulative solar radiation
observed at weather stations, searching for natural discontinuities to
determine the zoning threshold[11, 13]. For example, Lau et al. (2007) calculated the monthly
average clear sky index with solar radiation observations of 123 stations and
proposed a scheme containing 5 solar radiation zones through cluster analysis[14]. However,
due to the sparse and uneven distribution of ground observation stations, it is
often difficult to determine the zone to which a point far from the observation
stations belongs. Liu
et al. (2017) first divided 98 solar
radiation observation stations into 5 zones through K-Means clustering and then
adopted support vector machine to establish an empirical relationship between
global solar radiation and meteorological variables within each zone. Subsequently,
this relationship was used to predict the zones that more densely distributed
weather stations belong to, thus identifying more reliable zone boundaries than
that raised by Lau et al. (2017)[15]. As the regional zoning process
still relies on the spatial density of weather stations, the scheme proposed by
Liu et al. (2017) suffers from
incorrect zoning and inaccurate boundaries in the climate transition zone. Spatially
continuous estimates of surface solar radiation are the only method to
determine the accurate boundary of adjacent zones. A large number of studies
have demonstrated that remote sensing inversion products can capture regional
differences and hourly changes of surface solar radiation at the kilometer to
meter scale[16], so that they can be employed to
identify the boundary of solar radiation zones at fine scales. In addition,
traditional clustering methods require determining the number of solar
radiation zones based on prior knowledge. However, to determine the most
appropriate number of zones in practice is faced with serious challenges, and
inappropriate selection of the number of zones usually leads to undesirable or
even misleading results, such as over-fitting[17].
In view of the
diversification of zoning systems, inaccurate identification of zoning
boundaries, and difficulty in determining the right number of zones, a new
algorithm based on Gaussian mixture model is proposed to identify the
hierarchical system of solar radiation zoning and determine zoning boundaries
by using spatial continuous remote sensing inversion products[18]. The algorithm treats the number of zones as a random variable and
then automatically determines the most appropriate number from the training
data by virtue of Bayesian inference. Bayesian inference also ensures more
reliable zoning results by selecting a more appropriate prior distribution and
additional physical knowledge[19]. Through integrating surface solar radiation observations from 2007
to 2020 and remote sensing estimates with spatial and temporal continuity, the
algorithm proposed in previous studies is applied for solar radiation zoning and
boundary identification in China, thus generating the dataset on the boundaries
of hierarchical solar radiation zones in China.
2 Metadata of the Dataset
The
metadata of the Boundary dataset based on two algorithms of the hierarchical
solar radiation zones in China are summarized in Table 1.
Table 1 Metadata summary of the Boundary dataset based on two
algorithms of the hierarchical solar radiation zones in China
|
Items
|
Description
|
|
Dataset full name
|
Boundary dataset
based on two algorithms of the hierarchical solar radiation zones in China
|
|
Dataset short
name
|
SolarRadiationZones
|
|
Authors
|
Jiang, H.
DTW-0666-2022, Institute of Geographical Sciences and Resources Research, Chinese
Academy of Sciences, jiangh.18b@igsnrr.ac.cn
|
|
Geographical region
|
China
|
|
Year
|
Multi-year
average??2007?C2020??
|
|
Data format
|
.shp
|
|
|
|
Data size
|
3.10 MB
|
|
|
|
Data files
|
Containing 2
files: one is the boundaries of the five primary solar radiation zones; the
other is the boundaries of the ten sub-zones
|
|
Foundations
|
Open Fund of State Key Laboratory of Remote Sensing Science (OFSLRSS202204);
National Natural Science Foundation (42201382)
|
|
Data publisher
|
Global Change Research Data Publishing & Repository,
http://www.geodoi.ac.cn
|
|
Address
|
No. 11A, Datun
Road, Chaoyang District, Beijing 100101, China
|
|
Data sharing
policy
|
Data from the Global
Change Research Data Publishing & Repository includes metadata, dataset (in the Digital Journal of Global Change Data Repository), and
publications (in the Journal of Global Change Data & Discovery). Data sharing policy includes: (1) Data are openly
available and can be free downloaded via the Internet; (2) End users are
encouraged to use Data subject to citation; (3) Users, who are by definition
also value-added service providers, are welcome to redistribute Data
subject to written permission from the GCdataPR Editorial Office and the
issuance of a Data redistribution license; and (4) If Data are used to
compile new dataset, the ??ten per cent principal?? should be followed such
that Data records utilized should not surpass 10% of the new
dataset contents, while sources should be clearly noted in suitable places in
the new dataset[7]
|
|
Communication and searchable system
|
DOI, CSTR, Crossref, DCI, CSCD, CNKI,
SciEngine, WDS/ISC, GEOSS
|
3 Methods
3.1 Data Sources
The
raw data used in the dataset include ground station observations and remote
sensing inversion products of surface solar radiation. The ground measurements are
obtained from the monthly value dataset provided by the Meteorological Data
Center of the China Meteorological Administration, which
provides monthly average of the total solar radiation in units of 0.01 MJ/m2
at 98 solar radiation stations over the period from 2007 to 2020. Specific
procedures for quality control of the raw data include automatic checks of
physical thresholds, temporal continuity, and time series consistency, as well
as additional manual checks of automatically identified error records. More
stricter quality control needs to be implemented during the production of the
dataset through comparison to the reconstructed data based on remote sensing
inversions[22], i.e., data records with absolute difference ratios (divide the
difference between measured and reconstructed values by measured values)
greater than 20% are removed and then filled in by the multi-year average.
Remote sensing
inversion products used in this study come from research of Jiang et al.[2],
which developed a deep learning algorithm to retrieve the surface solar
radiation from geostationary meteorological satellite images. The algorithm
relies on convolutional neural networks to process the spatial proximity effect
of solar radiation transmission[23],
which significantly improves the inversion accuracy of surface solar radiation.
Dataset during the 2007 to 2020 have been published[24]
and are freely available, providing monthly averages of total surface solar
radiation at 0.05?? ?? 0.05?? resolution in China. Validation of data based on
ground-based solar radiation stations shows that the root mean square error of
the monthly average is about 1.49 MJ/m2[25],
which is better than other widely used products such as CERES-EBAF and
GEWEX-SRB[22].
3.2 Data Processing
Solar
radiation zoning mainly depends on cluster analysis, which is the process of
classifying a dataset into different classes or clusters, where objects in the
same cluster display great similarities while objects between different
clusters have great dissimilarities. Solar radiation zones in the dataset are
identified through a clustering method based on Gaussian mixture model (GMM),
which can smoothly approximate the density distribution of arbitrary shapes.
Our previous study[18]
examined the feasibility in solar radiation zoning using finite GMM and
infinite GMM. Specifically, the finite GMM generates zoning results under a
predefined zone number like the K-Means method while the infinite GMM model can
determine the appropriate number of zones adaptively with its Bayesian
properties. The results manifest that the finite GMM model is prone to
overfitting effects during the zoning process, while the infinite GMM can
effectively avoid overfitting and ensure that the zoning results fully reflect
the inherent characteristics of solar radiation in different regions[18].
Therefore, the infinite
GMM is adopted as a clustering algorithm in the dataset to implement
hierarchical identification of solar radiation zones in China. The
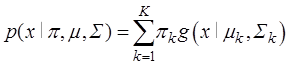
implementation process of the whole algorithm (as in Figrue 1) includes the
following main steps. First, taking the multi-year (2007?C2020) monthly average
of global solar radiation measured by ground solar radiation stations as input,
98 stations in China are clustered based on GMM clustering method. Second, by
inputting the spatially continuous multi-year average (2007?C2020) of global
solar radiation obtained by remote sensing inversion into the fitted GMM model
in step 1, the posterior probability of each pixel belonging to different
clusters is predicted, and the cluster label with the maximum probability is assigned
to the pixel. In this way, a spatially continuous zone map is generated. Third,
since the direct zoning results of the GMM model usually have raster polygons
with very small areas (containing only a few pixels or even one pixel), we
further use a sieve filter to remove polygons whose number of pixels are
smaller than the predefined threshold and assign the classification labels of
their neighboring polygons with the largest area to them. Fourth, with the zone
boundaries based on the obtained spatially continuous zone map extracted, post-processing
operations is performed such as smoothing the boundaries.
3.3 GMM Algorithm
A GMM is a mixture distribution consisting of K Gaussian
sub-distributions, which can be expressed as:
 (1)
(1)
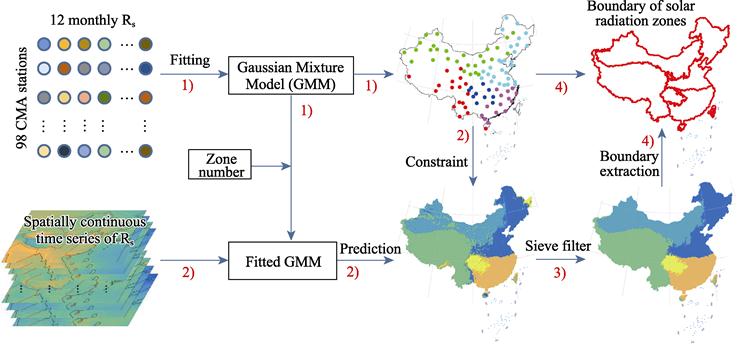
Figure 1 The process of acquiring the boundaries
of hierarchical solar radiation zones in China
where x refers to the data vector of N observations
(e.g., measurements from 98 stations) and each observation contains D
dimensional features (e.g., 12 monthly mean global solar radiation), ??k, k=1, ??, K represents
the mixture weights and satisfies  ??k=1, and
  , k=1, ??, K, denotes the
probability sub-distribution. Each sub-distribution is a D dimensional Gaussian function of the following form:
, k=1, ??, K, denotes the
probability sub-distribution. Each sub-distribution is a D dimensional Gaussian function of the following form:
 (2)
(2)
with mean vector  and covariance matrix
  . The complete GMM is parameterized by mean vectors
  , covariance matrices
  and mixture
weights
and mixture
weights  . Herein, we represent these
parameters by the notation:
. Herein, we represent these
parameters by the notation:  . Compared with the
classical unimodal Gaussian model or nearest neighbor model, GMM exhibits
better modeling capability owing to the combination of multiple Gaussian
functions. Expectation-maximization (EM) which is a widely used algorithm to
estimate the parameters of GMM aims to figure out the parameters that maximize
the likelihood of GMM on the training data. Given the training observations
. Compared with the
classical unimodal Gaussian model or nearest neighbor model, GMM exhibits
better modeling capability owing to the combination of multiple Gaussian
functions. Expectation-maximization (EM) which is a widely used algorithm to
estimate the parameters of GMM aims to figure out the parameters that maximize
the likelihood of GMM on the training data. Given the training observations 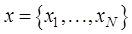 , the likelihood of GMM is
expressed as:
, the likelihood of GMM is
expressed as:
 (3)
(3)
EM begins with an initial  and estimates a new
  , such that
  . The new then becomes the initial for the next iteration. Notably, the
process is repeated until a convergence threshold is reached (details can refer
to the reference[18]).
. The new then becomes the initial for the next iteration. Notably, the
process is repeated until a convergence threshold is reached (details can refer
to the reference[18]).
4 Data Results and
Validation
4.1 Data Composition
The
dataset consists of two data files: one is the boundaries of the five primary
solar radiation zones; the other is the boundaries of the ten sub-zones.
4.2 Zoning Results
Figure 2 illustrates the 5
primary zones in the hierarchical solar radiation zoning system and their annual
solar radiation variations. The base map is the topography in China for
illustrating the geographical units involved in each zone. Zone I includes the
Qinghai-Tibet Plateau, Yunnan-Guizhou Plateau, and their surrounding areas, and
the monthly average global solar radiation in Zone I is always higher than that
in other regions, with the maximum value occurring in June at 24.8 MJ/m2
and the annual average global solar radiation of about 20.1 MJ/m2,
which is the result of the combined effect of high altitude, thin aerosols, and
low cloudiness[25]. Zone II includes the Junggar Basin, Tarim Basin, Inner Mongolia,
and part of the Loess Plateau. The annual average global solar radiation (16.3 MJ/m2)
of Zone II is in the second rank, but the absolute intra-annual variation is
the largest, with the highest in June and the lowest in December (a difference
of 15.6 MJ/m2). Zone III mainly covers the northern and northeastern
China, and the maximum global solar radiation of Zone III appears in June, with
a monthly average value of 18.4 MJ/m2. The changes of Zone II and
Zone III are almost synchronized, but the magnitude is different. Zone IV is
located in south of the Qinling-Huaihe line, including the middle and lower reaches of the Yangtze River plain, the southern
hills and the eastern part of the Yunnan- Guizhou plateau. Zone IV consists of
the Sichuan Basin and the Wuling Mountains. The annual average global solar
radiation of Zone IV and Zone V is 12.7 MJ/m2 and 11.2 MJ/m2, respectively; and their differences are mainly
concentrated in autumn and winter, when there is more solar radiation in Zone
IV. The highest global solar radiation of Zone IV occurs in July at 18.3 MJ/m2,
while that of Zone V occurs in August at 16.7 MJ/m2. In particular,
both Taiwan Island and Hainan
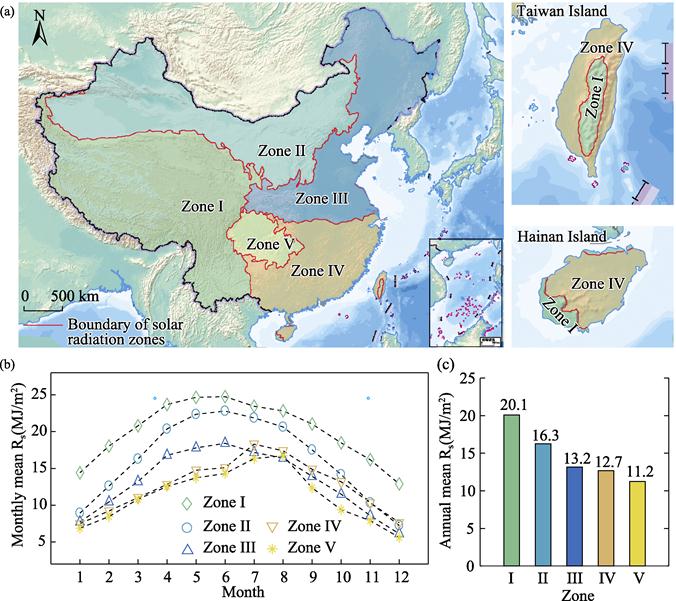
Figure 2 Maps of five primary zones in the
hierarchical solar radiation zoning system and their annual variations in solar
radiation
Island are involved in 2 zones. The solar
radiation characteristics of the central mountain of Taiwan Island and the
southwest region of Hainan Island are similar to those of Zone I, and those of
other regions of the islands are similar to those of Zone IV.
As the number of
zones determined by the GMM gradually increases, the 5 primary zones begin to
split and produce subzones. Figure 3a presents the results of the ultimate ten
subzones. The splitting process of the 5 primary zones is as follows. First,
the Junggar Basin and Xilinguole Steppe are separated from Zone II; then Zone I
is divided into 2 parts, i.e., Qinghai-Tibet Plateau and Yunnan-Guizhou
Plateau; subsequently, Zone II continues to split and forms a new zone on the
Loess Plateau; later, the Daxinganling and its western area are separated from
Zone III; and finally, Zone IV is classified into 2 parts with the dividing
line being close to the latitude line of approximately 23????3??N. The ten
subzones are marked by two-level labels. As can be seen from Figure 3a, the
spatial division of the ten subzones is basically within the boundaries of the
5 primary zones, and the boundaries between the major zones remain almost
unchanged, which indicates the stability of the five primary division schemes
determined by GMM. Hainan Island is still divided into two subzones, and its
southwestern region is similar to the Yunnan-Guizhou Plateau in terms of solar
radiation characteristics, while the other regions are closer to the southern
coastal zone of the mainland. Taiwan Island is redivided into three subzones encompassing
IV-A, IV-B, and I-B from north to south, indicating that its solar radiation
characteristics have higher similarity to those of the middle and lower reaches
of the Yangtze River region, the southern coastal region, and the
Yunnan-Guizhou Plateau.
Figure 3b compares
the variation of monthly average of global solar radiation in ten subzones. The
global solar radiation of subzone I-B is significantly lower than that of
subzone I-A, especially in summer. Their difference is primarily caused by
altitude difference. Under the influence of the North Indian Ocean monsoon, the
global solar radiation of subzone I-B fluctuates greatly. Influenced by summer
monsoon, the solar radiation received by zone II-B in May to September is less
than that in subzone II-A. The difference between subzone II-A and subzone II-C
is concentrated in winter, when the solar altitude angle of subzone II-C is
smaller on the whole, resulting in lower global solar radiation than subzone
II-A. The east and west parts of subzone II-C are basically within the same
latitudes, thus contributing to similar solar radiation characteristics. The
monthly average of global solar radiation of subzone III-A is lower than that
of subzone III-B in summer but higher in winter. The global solar radiation of
subzone IV-B is higher than subzone IV-A, especially in autumn and winter. Zone
IV (Sichuan basin and its surroundings) always has the lowest global solar
radiation among all subzones due to frequent cloudy and rainy weathers. It is
worthy to note that high mountains in the northwestern of the Sichuan basin
block the southeastern monsoon that carries water vapor, making the topographic
rain prevail in the basin. Meanwhile, the lower elevation of the basin relative
to the surrounding areas constitutes an enclosed space where evaporated water
vapor collects to form rainfall. Therefore, perennial fog and cloudy weather
reduce the amount of solar radiation received in the Sichuan Basin.
4.3 Data Validation
The validation of solar
radiation zoning results is a challenging task considering no real zone labels
are available for references. Herein, we make use of the solar radiation
dataset based on sunshine hours[26]
to manually divide 716 meteorological stations. From the analysis of the
results in Section 4.2, it can be tentatively determined that the GMM zoning is
mainly based on the total amount of global solar radiation and the difference
in seasonal variations.
Figure 3 Maps of the
subzones in the hierarchical solar radiation zoning system and their annual
variations in solar radiation
Afterwards,
we manually classify them based on corresponding rules and then compare the
classification results with the results of GMM.
The manual classification process is as follows: 1) Group the 716 stations
using the boundaries in Figure 3a and calculate the centroid of each group
according to the annual mean and monthly variation of solar radiation,
respectively; 2) Calculate the Euclidean distance from each station to the
centroid of the zone to which it belongs using the Dynamic Time Warping (DTW)
algorithm; 3) Calculate the distance from each station to the centroid of its
nearest neighbor employing the DTW algorithm; 4) If the distance of a station
to the centroid of its zone is greater than the distance to the centroid of its
nearest neighbor zone, the station is reassigned the label of its nearest
neighbor zone. The final comparison is depicted in Figure 4, where 642 of the
716 sites (circles) remain in its original zone, and only 74 sites (purple
symbols) are reassigned to a new zone. This result indicates that the GMM
basically divides the meteorological stations into correct solar radiation
zones and that the boundaries determined depending on spatially continuous
solar radiation from remote sensing inversions are relatively reliable. We also
note that most of the stations whose zones are changed fall inside the spatial
extent of the ten subzones rather than at the edges, suggesting that zoning
based on spatially continuous solar radiation can effectively avoid the
influence of individual unrepresentative stations.
5 Discussion
and Conclusion
The dataset provides the results of the hierarchical system with 5?C10
solar radiation zones in China. The experiments based on ground observations or
spatially continuous estimates of solar radiation support the establishment of
a hierarchical zoning system. The 5 primary zones

Figure 4 Map of manually zoning results of 716
meteorological stations in China based on solar radiation data derived from
sunshine hours (Note: The symbol of the station indicates that the point is
reclassified to the zone behind the label rather than the zone corresponding to
its location.)
mainly reflect the differences in solar radiation
caused by diverse climates, while the 10 subzones reveal the subtle differences
in seasonal variation of solar radiation due to local microclimate and
topographic influences. In China, the basic geographical units with distinct
climatic characteristics, such as Sichuan basin, Qinghai-Tibet plateau,
Yunnan-Guizhou plateau, and Loess plateau, have formed independent solar
radiation zones. It is observed that there are some similarities between the 10
subzones and the building climate zones. For example, the boundaries between
III-A and IV-A, IV-A and IV-B, and II-A and II-C-1 are basically consistent
with the building climate zone boundaries[14, 27,
28], indicating that the 10 subzones also reflect
the differences in surface heat distribution associated with differences in
solar radiation.
The dataset identifies
the precise boundaries of adjacent zones using spatially continuous solar
radiation estimates, overcoming the shortcomings of the station-based zoning
method. For instance, considering that Hainan Island and Taiwan Island have
obvious differences in internal solar radiation characteristics, it is crucial
to select an appropriate zoning scheme to divide them into different zones (as
shown in Figures 2a and 3a). It is likely that Hainan Island and Taiwan Island
would be considered a single zone if actual division were solely based on one
or a few observation stations within them. Spatially continuous estimates can distinguish
the nuances of solar radiation and therefore provide accurate pixel-level
zoning results, which are important for some specific applications, such as
assessing the potential of rooftop solar PV in mountainous areas to inform
energy sector decisions[5,
6]. Overall, it can
be concluded that different solar energy utilization strategies should be
implemented in the northern and southern of Hainan Island and the western and
eastern of Taiwan Island.
Author Contributions
Jiang, H. designed the algorithm that generates
the dataset. Yao, L. contributed to the data processing and analysis. Jiang, H.
wrote the data paper.
Conflicts of Interest
The
authors declare no conflicts of interest.
References
[1]
Ding, Z. L. Carbon neutral
framework roadmap study in China [J]. China Industry & Information Technology,
2021(8): 54?C61.
[2]
Jiang, H., Lu, N., Qin, J., et al. A deep learning algorithm to
estimate hourly global solar radiation from geostationary satellite data [J]. Renewable
and Sustainable Energy Reviews, 2019, 114: 109327.
[3]
Kabir, E., Kumar, P., Kumar,
S., et al. Solar energy: potential
and future prospects [J]. Renewable and Sustainable Energy Reviews,
2018, 82: 894?C900.
[4]
Zhang, Y., Ren, J., Pu, Y., et al. Solar energy potential
assessment: a framework to integrate geographic, technological, and economic
indices for a potential analysis [J]. Renewable Energy, 2020, 149:
577?C586.
[5]
B??dis,
K., Kougias, I., Jäger-Waldau, A., et al.
A high-resolution geospatial assessment of the rooftop solar photovoltaic
potential in the European Union [J]. Renewable and Sustainable Energy
Reviews, 2019, 114: 109309.
[6]
Sweerts, B., Fenninger, S.,
Yang, S., et al. Estimation of losses
in solar energy production from air pollution in China since 1960 using surface
radiation data [J]. Nature Energy, 2019, 4(8): 657?C663.
[7]
Mensour, O. N., Ghazzani, B.
E., Hlimi, B., et al. A geographical
information system-based multi-criteria method for the evaluation of solar
farms locations: a case study in Souss-Massa area, southern Morocco [J]. Energy,
2019, 182: 900?C919.
[8]
Lin, A. L. Research on
assessment and planning of available space of urban solar applications [D].
Harbin: Harbin Institute of Technology, 2020.
[9]
Walsh, A., C??stola, D., Labaki,
L. C. Review of methods for climatic zoning for building energy efficiency
programs [J]. Building and Environment, 2017, 112: 337?C350.
[10]
Wan, K., Li, D., Yang, L., et al. Climate classifications and
building energy use implications in China [J]. Energy and Buildings,
2010, 42(9): 1463?C1471.
[11]
Wang, B. Z. Solar energy
resource division in China [J]. Acta Energiae Solaris Sinica, 1983(3):
221?C228.
[12]
Al-Azri, N. A., Zurigat, Y. H.,
Al-Rawahi, N. Z. Development of bioclimatic chart for passive building design
[J]. International Journal of Sustainable Energy, 2013, 32(6): 713?C723.
[13]
Zhou, Y., Wu, W., Hu, Y., et al. The temproal-spatial
distribution and evaluation of potential solar energy resources in Northwest China
[J]. Journal of Natural Resource, 2010, 25(10): 1738?C1749.
[14]
Lau, C. C. S., Lam, J. C.,
Yang, L. Climate classification and passive solar design implications in China
[J]. Energy Conversion and Management, 2007, 48(7): 2006?C2015.
[15]
Liu, Y. F., Yong, Z., Wang, D.,
et al. Classification of solar
radiation zones and general models for estimating the daily global solar
radiation on horizontal surfaces in China [J]. Energy Conversion and
Management, 2017,
154: 168?C179.
[16]
Jiang, H., Lu, N., Qin, J., et al. Hourly 5-km surface total and
diffuse solar radiation in China, 2007?C2018 [J]. Scientific Data, 2020,
7(1): 311.
[17]
Antoniak, C. E., Mixtures of
dirichlet processes with applications to Bayesian nonparametric problems [J]. The
Annals of Statistics, 1974, 2(6): 1152?C1174.
[18]
Jiang, H., Lu, N., Qin, J., et al. Hierarchical identification of
solar radiation zones in China [J]. Renewable and Sustainable Energy Reviews,
2021, 145: 111105.
[19]
Soubdhan, T., Emilion, R.,
Calif, R. Classification of daily solar radiation distributions using a mixture
of Dirichlet distributions [J]. Solar Energy, 2009, 83(7): 1056?C1063.
[20] Jiang, H. Boundary dataset based on two algorithms of the
hierarchical solar radiation zones in China [J/DB/OL]. Digital Journal of Global
Change Data Repository, 2023. https://doi.org/10.3974/geodb.
2023.07.07.V1.
https://cstr.escience.org.cn/CSTR:20146.11.2023.07.07.V1.
[21]
GCdataPR
Editorial Office. GCdataPR data sharing policy [OL]. https://doi.org/10.3974/dp.policy.2014.05
(Updated 2017).
[22]
Zhang, X. T., Liang, S., Wild,
M, et al. Analysis of surface
incident shortwave radiation from four satellite products [J]. Remote
Sensing of Environment, 2015, 165: 186?C202.
[23]
Jiang, H., Lu, N., Huang, G., et al. Spatial scale effects on
retrieval accuracy of surface solar radiation using satellite data [J]. Applied
Energy, 2020, 270: 115178.
[24]
Jiang, H., Lu, N.
High-resolution surface global solar radiation and the diffuse component
dataset over China [DB/OL]. Pangaea, 2019.
https://doi.pangaea.de/10.1594/PANGAEA.904136.
[25]
Jiang, H., Yang, Y., Wang, H., et al. Surface diffuse solar radiation
determined by reanalysis and satellite over East Asia: evaluation and comparison
[J]. Remote Sensing,
2020, 12: 1387.
[26]
Tang, W. J. Daily mean solar
radiation dataset of 716 weather stations in China (1961?C2010) [DB/OL].
National Tibetan Plateau Data Center, 2015.
https://doi.org/10.11888/AtmosphericPhysics.tpe.249399.file.
[27]
Wan, K. K. W., Yang, H. L.,
Yang, L., et al. An analysis of
thermal and solar zone radiation models using an Angstrom?CPrescott equation and
artificial neural networks [J]. Energy, 2008, 33(7): 1115?C1127.
[28]
Bai, L., Yang, L., Song, B., et al. A new approach to develop a
climate classification for building energy efficiency addressing Chinese
climate characteristics [J]. Energy, 2020, 195: 116982.