Spatial-temporal Annual Precipitation Dataset in the
China–Mongolia–Russia Economic Corridor (1982–2018, 1-km/y)
Li, G. S.1,2 Yu, L. X.1* Liu, T. X.2 Bu, K.1 Yang, J. C.1 Jiao, Y.1,3 Bao, Y. L.4 Zhang, S. W.
1. Remote Sensing and
Geographic Information Research Center, Northeast Institute of Geography and
Agroecology, Chinese Academy of Sciences, Changchun 130102, China;
2. School of
Geography Science, Changchun Normal University, Changchun 130032, China;
3. School of Life
Science, Liaoning Normal University, Dalian 116081, China;
4. School of
Geography Science, Inner Mongolia Normal University, Hohhot 010022, China
Abstract: A spatial interpolation analysis of
precipitation in the China–Mongolia–Russia Economic Corridor over the past 37
years was carried out, and an optimal model was selected to generate a 1 km
network dataset, which can be used to support the study of economic
development, vegetation distribution, climate change, and ecological
environment construction in the China– Mongolia–Russia Economic Corridor. Based
on measured data of 353 meteorological stations in the China–Mongolia–Russia
Economic Corridor region, operations such as reading, merging, checking, and
statistical spatial interpolation batch code generation of data were performed.
In addition, longitude and latitude were used as variables in the ANUSPLIN
software interpolation to square the precipitation. Using the thin-disk smooth
spline method, a 1 km grid interpolation dataset of precipitation in China,
Mongolia, and Russia from 1982 to 2018 was obtained. The correlation
coefficient (R²) was used to verify
the correlation between the interpolation results and the meteorological
station data, and the R² was 0.937,7.
The mean absolute error (MAE) and the root mean square error (RMSE) were used
as the accuracy evaluation indicators, and the average values of MAE and RMSE
were 4.546,4 and 2.305,7 mm, respectively. The dataset includes the raster data
of the annual average precipitation for each year from 1982 to 2018. The
dataset is archived in .tif format with a spatial resolution of 1 km and
consists of 185 data files with a data size of 5.43 GB. This raster dataset is
relatively new in terms of accuracy and time series, and is openly shared and
downloaded. It can provide data support for research on the terrestrial
ecosystems and spatiotemporal changes in the China–Mongolia–Russia Economic
Corridor.
Keywords: China–Mongolia–Russia Economic Corridor;
annual precipitation; ANUSPLIN; 1 km
DOI: https://doi.org/10.3974/geodp.2022.03.13
CSTR: https://cstr.escience.org.cn/CSTR:20146.14.2022.03.13
Dataset Availability Statement:
The dataset supporting this paper was published and is
accessible through the Digital Journal of
Global Change Data Repository at: https://doi.org/10.3974/geodb.2022.02.07.V1 or https://cstr.escience.org.cn/CSTR:20146.11.2022.02.07.V1.
1
Introduction
The ??Belt and Road?? initiative is launched by China to
promote international cooperation and a win–win situation in the new era, to
build an ecological civilization, and to jointly achieve the 2030 sustainable
development goals[1]. The ??China–Mongolia–Russia Economic Corridor??
is one of the six economic corridors of the Silk Road. The construction of the
??China–Mongolia–Russia Economic Corridor?? will bring great benefits to the
countries along the route; however, there are huge differences in the resources
and environmental conditions in different regions, complex and diverse
ecosystems, and fragile ecological environments, which have had a profound
impact on regional social and economic development. Therefore, as there is a
need to strengthen the protection of the environment, biodiversity and natural
resources, to respond to climate change, to fight against and reduce disasters,
to improve disaster risk management capabilities, and to promote pragmatic
cooperation in the fields of tourism, think tanks, media, renewable energy, and
energy efficiency, a series of related studies are being conducted[2,3]. Therefore, it is necessary to establish a set
of high-resolution, long-term series, and annual precipitation grid interpolation
datasets to provide basic meteorological data for the construction of the
??China–Mongolia–Russia Economic Corridor??, and for the study of the
environment, vegetation, and water conservancy.
These data are based on the daily precipitation data of 353
meteorological stations in the ??China–Mongolia–Russia Economic Corridor?? area
from 1982 to 2018. The widely used ANUSPLIN software meteorological data
spatial interpolation method, developed by the Australian National University,
is used. Longitude and latitude are used as the variables interpolated by
ANUSPLIN software. The thin plate spline (TPS) method was used to generate a 1
km grid interpolation dataset of precipitation in the ??China-Mongolia-Russia
Economic Corridor?? from 1982 to 2018, and this was compared with the actual
values of the meteorological stations.
2 Metadata
of the Dataset
The
metadata of the Spatial-temporal annual precipitation dataset of the
China–Mongolia– Russia Economic Corridor (1982–2018, 1-km/y)[4] are summarized in Table 1. They include the
dataset full name, short name, authors, dataset year, temporal resolution,
spatial resolution, data format, data size, data files, data publisher, data
sharing policy, etc.
3 Methods
3.1
Data Sources
The data
of meteorological stations in China used in this dataset come from the ??Annual
Value Dataset of China??s Surface Climate Data?? released by the National
Meteorological Science Data Center. A total of 108 meteorological stations in
the study area were selected from meteorological stations in Russia and
Mongolia. The data come from the daily observation data provided by the
National Oceanic and Atmospheric Administration (NOAA) of the United States. A
total of 224 meteorological stations in Russia and 21 meteorological
Table 1 Metadata summary of the Spatial-temporal
annual precipitation dataset of the China–Mongolia– Russia Economic Corridor
(1982–2018, 1-km/y).
|
Items
|
Description
|
|
Dataset
full name
|
Spatial-temporal
annual precipitation dataset in China–Mongolia–Russia Economic Corridor
(1982–2018, 1-km/y)
|
|
Dataset
short name
|
CMREC_Prcp
|
|
Authors
|
Li,
G. S. HGB-7976-2022, Remote Sensing and Geographic Information Research
Center, Northeast Institute of Geography and Agroecology, Chinese Academy of
Sciences, liguangshuai@iga.ac.cn
Yu,
L. X., Remote Sensing and Geographic Information Research Center, Northeast
Institute of Geography and Agroecology, Chinese Academy of Sciences,
yulingxue@iga.ac.cn
|
|
|
Liu,
T. X., School of Geography Science, Changchun Normal University,
liutingxiang@ccsfu.edu.cn
Bu,
K., Remote Sensing and Geographic Information Research Center, Northeast
Institute of Geography and Agroecology, Chinese Academy of Sciences,
bukun@iga.ac.cn
Yang,
J. C., Remote Sensing and Geographic Information Research Center, Northeast
Institute of Geography and Agroecology, Chinese Academy of Sciences,
yangjiuchun@iga.ac.cn
Jiao,
Y., Remote Sensing and Geographic Information Research Center, Northeast
Institute of Geography and Agroecology, Chinese Academy of Sciences,
jiaoyue@iga.ac.cn
Bao,
Y. L., School of Geography Science, Inner Mongolia Normal University,
baoyulong@imnu.edu.cn
Zhang,
S. W., Remote Sensing and Geographic Information Research Center, Northeast
Institute of Geography and Agroecology, Chinese Academy of Sciences,
zhangshuwen@iga.ac.cn
|
|
Geographical region
|
including
China, Mongolia, parts of Russia (27??47¢N–61??57¢N,
25??51¢E–157??51¢E)
|
|
Year
|
1982–2018
Temporal
resolution Year
Spatial
resolution 1 km
|
|
Data
format
|
.tif
|
Data
size
|
5.43 GB
|
|
Data
files
|
Including
37 annual average precipitation data files in the China-Mongolia-Russia
Economic Corridor. Among them: yyyy_prcp.tif is the annual average
precipitation data, such as 1982_prcp.tif is the 1982 average precipitation
data
|
|
Foundations
|
Chinese
Academy of Sciences (XDA2003020301); National Natural Science Foundation of
China (42071025); Ministry of Science and Technology of P. R. China (2017FY101301)
|
|
Data
publisher
|
Global Change Research Data Publishing &
Repository, http://www.geodoi.ac.cn
|
|
Address
|
No.
11A, Datun Road, Chaoyang District, Beijing 100101, China
|
|
Data
sharing policy
|
Data from
the Global Change Research Data Publishing & Repository includes metadata, datasets
(in the Digital Journal of Global Change Data Repository), and
publications (in the Journal of Global Change Data & Discovery). Data sharing policy
includes: (1) Data are openly available and can be free downloaded via the
Internet; (2) End users are encouraged to use Data subject to
citation; (3) Users, who are by definition also value-added service
providers, are welcome to redistribute Data subject to written permission
from the GCdataPR Editorial Office and the issuance of a Data redistribution
license; and (4) If Data are used to compile new
datasets, the ??ten per cent principal?? should be followed such that Data
records utilized should not surpass 10% of the new dataset contents, while
sources should be clearly noted in suitable places in the new dataset[5]
|
|
Communication and searchable system
|
DOI, CSTR, Crossref, DCI, CSCD, CNKI, SciEngine, WDS/ISC, GEOSS
|
stations in Mongolia were selected.
In the end, a total of 353 surface meteorological stations in the China–Mongolia–Russia Economic Corridor
were selected (Figure 1). The precipitation data for the three countries
were organized into a format suitable for use by the ANUSPLIN software for subsequent
spatial batch interpolation processing. The boundary of the China– Mongolia–Russia
Economic Corridor refers to the spatiotemporal dataset of the average
temperature in the China–Mongolia–Russia Economic Corridor[6].
Digital elevation model (DEM) data come from the Global
Multi-resolution Terrain Elevation Data (GMTED2010), the United States
Geological Survey (USGS), and a spatial dataset of global land areas jointly launched
by the National Geospatial-Intelligence Agency (NGA). This dataset was released
in 2010 with a spatial horizontal resolution of 30 arcseconds. The DEM data in
this study are based on the GMTED2010 data, are processed by ArcGIS 10.3
software, and are spatially integrated to obtain DEM data with a spatial
resolution of 1 km (Figure 1). The ArcGIS software is then used to convert to
the ASCII format for backup.
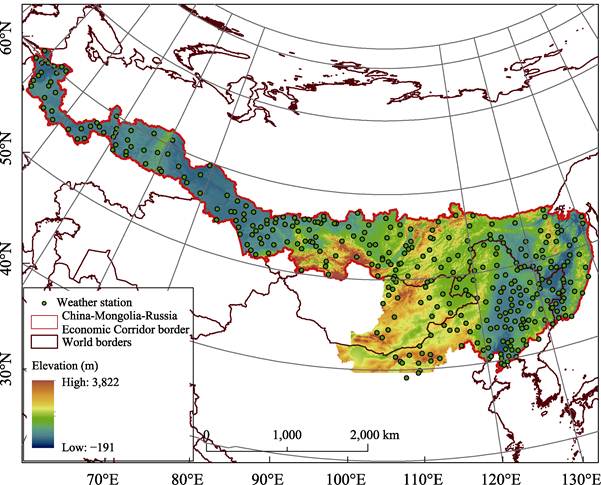
Figure
1 Spatial distribution
and digital elevation model (DEM) of ground meteorological
stations in the China–Mongolia–Russia Economic Corridor
3.2
Research Method
This year??s precipitation spatiotemporal dataset uses a
multivariate data interpolation analysis software product (ANUSPLIN) developed
by the Australian National University[7,8]. The two modules, APLINA and LAPGRD, are mainly
used for precipitation and temperature interpolation. The built-in thin-disk
smooth spline function interpolation effect is superior to Kriging and other
interpolation methods[9–11]. In the spatial interpolation of precipitation
in this dataset, the optimal spatial interpolation model is used; that is, the
local thin-disk smooth spline function with latitude and longitude as independent
variables[12], and the interpolation effect is best when the
number of test splines is set to 2.
3.3 Technical Route
The generation process of this dataset includes four parts:
source data input, source data processing, data output, and spatial
interpolation (the main process is shown in Figure 2). The source data input,
processing, and output include integrating the precipitation data and
meteorological station information in the China–Mongolia–Russia Economic
Corridor from 1982 to 2018 and using SPSS software to process it into a data
format suitable for ANUSPLIN software. In addition, ArcGIS is used to resample
the DEM data to 1 km, crop and transform the projections, and output it in the
ASCII format reserved for interpolation. Spatial interpolation is mainly
completed in ANUSPLIN software by writing splina.cmd and lapgrd.cmd scripts.
3.4 Error Analysis
In order to verify the accuracy of the ANUSPLIN
interpolation, this paper uses correlation analysis and error analysis to test
the accuracy of the interpolation results[13–15]. To test the correlation between the predicted
value and the observed value of the weather station, the correlation
coefficient (R2) was
calculated:
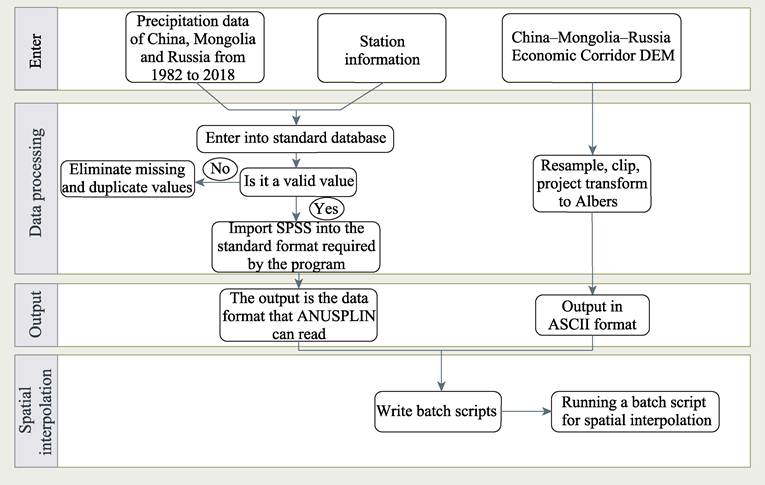
Figure 2 Dataset research and development
technology flow chart
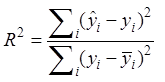 (1)
(1)
The formula numerator represents the residual predicted
using the predicted value, and the denominator denotes the residual predicted
using the sample mean for all data. When R2
< 0, the residuals of the model predicted results are larger than the
residuals of the baseline model (predicting all data with the sample mean),
indicating that the model predicted results are very poor. When R2 > 0, the larger the R2, the smaller the residual
error of the model prediction result, and the better the prediction effect.
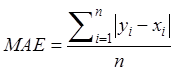
 (2)
(2)
where m is the number of stations, and x(i). and y(i) represent the observed and predicted values of the i-th weather station, respectively. The
mean absolute error reflects the true error, which is the average of the
absolute errors. The smaller the MAE, the smaller the error.
 (3)
(3)
where n is the
number of stations, and yi and xi represent the observed and estimated values of
the i-th station, respectively.
4 Data Results
and Validation
4.1 Data Composition
The spatiotemporal dataset of annual precipitation in the
China–Mongolia–Russia Economic Corridor (1982–2018, 1-km/y) includes 37 data
files of annual average precipitation in the China–Mongolia–Russia Economic
Corridor. Among them, yyyy_prcp.tif is the annual average precipitation data;
for example, 1982_prcp.tif is the 1982 average precipitation data.
4.2 Data Results
Figure 3 shows the spatial distribution of the average
annual precipitation from 1982 to 2018 obtained using ANUSPLIN software
interpolation. It can be seen from the figure that the precipitation in the
entire China–Mongolia–Russia Economic Corridor shows a clear trend of
decreasing from the coast to the inland. The annual precipitation difference
between the low-value area and the high-value area in the entire study area is
more than 1000 mm, and the difference is very significant. The annual
precipitation in western Inner Mongolia along with the South Gobi League and
East Gobi League of Mongolia is less than 100 mm, and this is the area with the
least annual precipitation in the China–Mongolia–Russia Economic Corridor. The
annual precipitation is greater than 800 mm in the western part of the Republic
of Khakassia, southeastern Kemerovo Oblast, southern Krasnoyarsk Territory,
southern Altai Territory, and southwestern Buryatia. On the Pacific coast,
China??s Liaoning province and the eastern part of Jilin province, as well as
Russia??s coastal border region and the eastern region of Khabarovsk Krai, the
precipitation can reach more than 800 mm.
The relationship
between precipitation and topography is very close, especially in coastal
areas. In the China–Mongolia–Russia Economic Corridor, there are the Changbai
Mountains and the Xiaoxing??an Mountains in the eastern part of Northeast China.
They are closer to the ocean and thus receive more ocean water vapor. The warm
and humid air from the ocean is forced to lift when it encounters the
mountains, forming more terrain rain. Although the Greater Xing??an Mountains in
Northeast China are farther from the sea, they receive less warm and humid
ocean water vapor than the Xiao Xing??an Mountains and the Changbai Mountains, and have less precipitation. Mongolia??s
Ulaanbaatar City, Selenge League, Orkhon League, and parts of Kent League have
slightly more precipitation due to terrain uplift. The eastern part of Russia
is mainly blocked by the Sikhote Mountains, which traps the warm and humid
water vapor of the Pacific Ocean on the windward slopes of the mountains.
4.3 Data Validation
Using the measured values of meteorological stations in the
China–Mongolia–Russia Economic Corridor region and the ANISPLIN interpolation
results to verify the accuracy, the results are shown in Figure 5. The
verification results show that the ANUSPLIN software can better simulate the
distribution of the annual average precipitation in the China–Mongolia–Russia
Economic Corridor with latitude and longitude as the independent variables. The
correlation coefficient (R2)
ranged from 0.873,5 to 0.989,5, the root mean square error (RMSE) was 0.863,9–4.986,1
mm, and the mean absolute error (MAE) was 1.3654–13.542,4 mm. From the
perspective of the correlation coefficient, root mean square error and mean
absolute error, the ANUSPLIN interpolation software has relatively high
accuracy in interpolating multi-year precipitation in the China–Mongolia–Russia
Economic Corridor.
5 Discussion and Conclusion
Based
on the precipitation data of meteorological stations, station information, and
DEM data in the area, this dataset uses ANUSPLIN meteorological interpolation
software to establish a 1 km annual precipitation grid data in the China–Russia–Mongolia
Economic Corridor from 1982 to 2018. The results of the observation and the
interpolation of the meteorological stations are used for verification. The
verification results show that the average value of the correlation coefficient
(R2) is 0.937,7, the
average value of the root
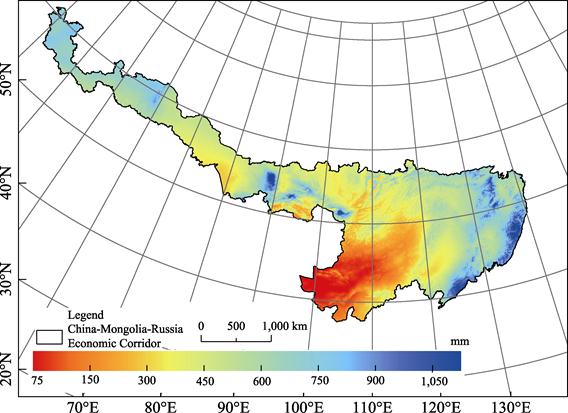
Figure 3 Distribution
map of annual average precipitation in the China–Mongolia–Russia Economic Corridor
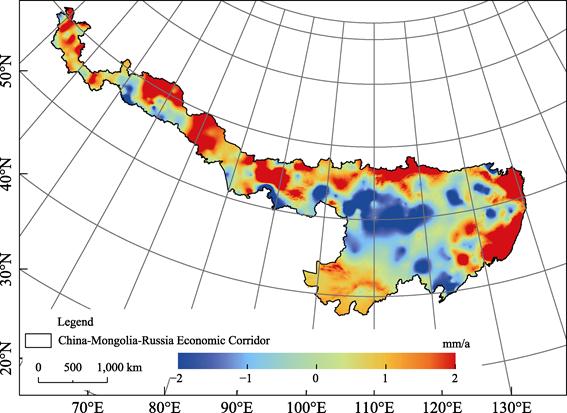
Figure
4 Spatial distribution
of the slope rate of annual average precipitation changes in the China–Mongolia–Russia
Economic Corridor from 1982 to 2018
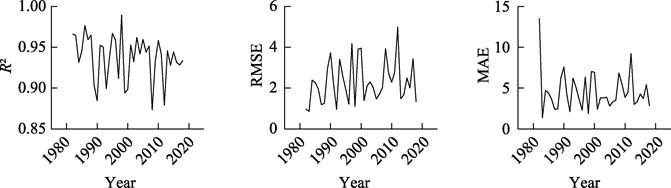
Figure 5 Average precipitation and interpolation
results accuracy verification from 1982 to 2018
mean square error
(RMSE) is 2.305,7 mm, and the average value of the mean absolute error (MAE) is
4.546,4 mm, while the verification shows that the accuracy of the ANUSPLIN
interpolation is high. The dataset reflects the distribution of annual
precipitation in the China–Mongolia–Russia Economic Corridor from 1982 to 2018,
and provides basic meteorological data for the construction of the
??China–Mongolia–Russia Economic Corridor??. In addition, it provides data
support for the study of the environment, vegetation, water conservancy, and
the ecology, along with social and other aspects.
Author Contributions
Yu, L. X., Liu, T. X. designed the algorithms of dataset.
Li, G. S., Jiao, Y., Bao, Y. L., Bu, K., Yang, J. C., Zhang, S. W., contributed
to the data processing and analysis. Li, G. S., Yu, L. X. wrote the data paper.
Conflicts
of Interest
The
authors declare no conflicts of interest.
References
[1]
Wang, W. F.,
Xu, Q. H. Integrating China??s ecological civilization building and 2030 agenda
for sustainable development [J]. Global
Review, 2021, 13(4): 134-151, 157, 158.
[2]
Ge, X. R.
The prospective energy cooperation between Russia and Northeast Asian countries
[J]. Commercial Research, 2007(2):
153–155.
[3]
Fu, J. Y.
The triangular relationship between China, Mongolia and Russia and China??s
strategic choice [J]. World Economy and
Politics, 2010(4): 43–45.
[4]
Li, G. S.,
Liu, T. X., Yu, L. X., et al.
Spatial-temporal annual precipitation dataset in China-Mongolia-Russia Economic
Corridor (1982–2018, 1-km/y) [J/DB/OL]. Digital
Journal of Global Change Data Repository,
2022, https://doi.org/10.3974/geodb.2022.02.07.V1. https://cstr.escience.org.cn/CSTR:20146.11.2022.02.07.V1.
[5]
GCdataPR
Editorial Office. GCdataPR data sharing policy [J/OL]
https://doi.org/10.3974/dp.policy. 2014.05 (Updated 2017).
[6]
Jiao, Y.,
Yu, L. X., Li, G. S., et al.
Spatial-temporal mean temperature dataset in China-Mongolia-Russia Economic
Corridor (1982–2018, 1-km/y) [J/DB/OL]. Digital
Journal of Global Change Data Repository, 2022.
https://doi.org/10.3974/geodb.2022.01.03.V1.
[7]
Hijmans, R.
J., Cameron, S. E., Parra, J. L., et al.
Very high resolution interpolated climate surfaces for global land areas [J]. International Journal of Climatology,
2005, 25(15): 1965–1978.
[8]
Liu, Z. H.,
McVicar, T. R., Niel, V., et al.,
Special climate data spatial interpolation software ANUSPLIN and its
application [J]. Meteorological Monthly,
2008(2): 92–100.
[9]
Tan, J. B.,
Li, A. N., Lei, G. B. Contrast on Anusplin and Cokriging meteorological spatial
interpolation in southeastern margin of Qinghai-Xizang Plateau [J]. Plateau Meteorology, 2016, 35(4):
875–886.
[10]
Liao, R. W.,
Cao, L. J., Zhang, D. B., et al.
Validation of gridded precipitation and temperature date over China [J]. Meteorological Science and Technology,
2017, 45(2): 364–374.
[11]
Qian, Y. L.,
Lv, H. Q., Zhang, Y. H. Application and assessment of spatial interpolation
methon on daily meteorological
elements based on ANUSLIN software [J]. Journal
of Meteorology and Environment, 2010, 26(2): 7–15.
[12]
Liu, Z. H.,
McVicar, T. R., Niel, V., et al.
Interpolation for time series of meteorological variables using ANUSPLIN [J]. Journal of Northwest A&F University (Natural Science),
2008(10): 227–234.
[13]
Xu, X. Q.,
Zhu, M. X. Comparison of temperature spatial interpolation methods based on GIS
in Jiangxi province [J]. Journal of Green
Science and Technology, 2021, 23(10): 21–24.
[14]
Meng, Q.
Spatio-temporal variation and acquisition of raster dataset of precipitation in
the Qinling Mountains [D]. Xi??an: Northwest University, 2021.
[15]
Bai, Y.
Development of the spatio-temporal variations dataset of NDVI in Qinling-Daba
Mountains of China (2000–2019) [J]. Journal
of Global Change Data & Discovery,
2020, 4(3): 346–353. https://doi.org/10.3974/geodp.2020.03.13.
https://cstr.escience.org.cn/CSTR:20146.14.2020.03.13.