A Dataset of Regional Three-dimensional Development Density in the Pearl River Delta Megalopolis of China
Li, S. F.1 Ye, Y. Y.2*
1. Guangdong Open Laboratory of Geospatial Information Technology and Application, Guangzhou Institute of Geography, Guangzhou 510070, China;
2. Key Laboratory of Land Surface Pattern and Simulation, Institute of Geographic Sciences and Natural Resources Research, Chinese Academy of Sciences (CAS), Beijing 100101, China
Abstract: Based on Landsat TM/HJ-1A remote sensing imagery, Defense Meteorological Program (DMSP) Operational Line-Scan System (OLS) night-time lighting image data for 1998, 2006, and 2012, and county-level economic output data for the Pearl River Delta Megalopolis (PRDM) in China, this study applied a three-dimensional evaluation model to measure the regional development density of the PRDM, and obtained a dataset of regional three-dimensional development density in the PRDM. The results showed that from 1998 to 2012, the urban area of the PRDM expanded rapidly. The development intensity of the PRDM increased from 8.08% to 16.93%, and the economic intensity increased from 191 million Yuan/km2 to 594 million Yuan/km2, but the development compactness declined from 0.008,2 to 0.006,5, indicating that the spatial form of PRDM tended to be more fragmented. The dataset includes the following key information. (1) Geographic boundary data of the study area. (2) Three-dimensional regional development density at the township level in 1998, 2006, and 2012: a) spatial data regarding development intensity; b) spatial data regarding development compactness; c) spatial data regarding economic intensity. (3) Non-agricultural GDP data at 1-km resolution. The data were archived in the .shp and .tif formats, with a data size of 27.5 MB (compressed to one single file of 17.5 MB). The analysis results of the dataset were published in Tropical Geography, 2017, Volume 37, Issue 1.
Keywords: Pearl River Delta megalopolis; regional development density; non-agricultural GDP (NAGDP) at 1-km resolution; Tropical Geography
1 Introduction
Urban sprawl is defined as low-density development at the edge of a city[1–2]. It is a state of urban development that is the complete opposite of the urban development concept of compact cities and smart growth that is currently advocated[3]. This out-of-control state of urbanization threatens the sustainable development of cities and regions[4]. Therefore, a large number of studies have focused on the phenomenon of urban sprawl. However, compared with the phenomenon of urban sprawl itself, there have been fewer studies focused on development density. Traditionally, the density of regional land development is only a single-dimensional indicator. It is generally expressed by the ratio of the built-up area to the total area, which is similar to the concept of growth density. However, this indicator cannot reflect differences in the layout pattern and development level of built-up land among different regions. Therefore, a multi-dimensional assessment of the regional development density in urban agglomerations could determine the mode and characteristics of land development, and optimize the development pattern of urban agglomerations. Using Landsat TM/HJ-1A remote sensing imagery and Defense Meteorological Satellite Program (DMSP) Operational Line-Scan System (OLS) night-time lighting image data, we developed a dataset of regional three-dimensional development density in the Pearl River Delta Megalopolis (PRDM), from the three dimensions of development intensity, development compactness, and development density. This dataset will provide a reference for urban planners and land managers in the PRDM.
2 Metadata of Dataset
The metadata of the “Regional development density by three dimensions dataset in Pearl River Delta megalopolis (1998, 2006, 2012)”[5] is summarized in Table 1. It includes the dataset full name, short name, authors, year of the dataset, temporal resolution, spatial resolution, data format, data size, data files, data publisher, and data sharing policy, etc.
3 Methods
3.1 Algorithm Principles
Because the traditional concept of regional development density overlooks the spatial distribution pattern and the development level of built-up land, in this dataset a three-dimensional (3-D) evaluation model of regional development density was constructed. The three dimensions were the scale of built-up land, spatial distribution pattern, and development density. The scale of built-up land was indicated by the index of development intensity (I). The spatial distribution pattern was determined by the index of development compactness (C), which has several indicators, such as the compactness index, the fragmentation index, and the fractal dimension. The development density (D) can be reflected by several indicators such as building height, building density, floor area ratio, and economic density (Table 2). Considering the data availability and computational convenience, the proportional area of built-up land was used as a proxy of the development intensity, the development compactness was indicated by the compactness index from the landscape index, and the development level was indicated by the economic density of the built-up land. For the calculation of economic density, the available statistics were all based on administrative units, and were mainly at or above the county level. Therefore, they could not indicate the spatial differences of economic density inside the county, which limits the evaluation of regional development density. Therefore, the dataset used DMSP/OLS nighttime lighting data, built-up land data, and statistical data to map the finer scale non-agricultural GDP (NAGDP).
Table 1 Metadata summary of the “Regional development density by three dimensions dataset in Pearl River Delta megalopolis (1998, 2006, 2012)”
|
Items
|
Description
|
|
Dataset full name
|
Regional development density by three dimensions dataset in Pearl River Delta megalopolis (1998, 2006, 2012)
|
|
Dataset short name
|
RDD3D_PearlRiverDelta
|
|
Authors
|
Li, S. F. S-9780-2018, Guangzhou Institute of Geography, li_shengfa@126.com
Ye, Y. Y. X-6411-2018, Guangzhou Institute of Geography, yeyuyao@gdas.ac.cn
|
|
Geographical region
|
Pearl River Delta Megalopolis (PRDM) Year 1998, 2006, 2012
|
|
Temporal resolution
|
6 to 8 years Spatial resolution Township scale, 1 km
|
|
Data format
|
.shp, .tif Data size 17.5 MB (after compression)
|
|
Data files
|
The dataset consists of 52 data files, including one compressed file package, with three data folders and 52 data files:
1) Geographic boundary data of the PRDM, containing eight data files. Data size is 0.69 MB
2) Three-dimensional regional development density at the township level in 1998, 2006, and 2012, containing 24 data files. Data size is 17.2 MB
3) Non-agricultural GDP data at 1-km resolution for 1998, 2006, and 2012, containing 12 data files. Data size is 1.71 MB
|
|
Foundations
|
National Natural Science Foundation of China (41671130); Guangdong province of China (2015A030313867); Guangzhou of China (201707010427 GDAS)
|
|
Data publisher
|
Global Change Research Data Publishing & Repository, http://www.geodoi.ac.cn
|
|
Address
|
No. 11A, Datun Road, Chaoyang District, Beijing 100101, China
|
|
Data sharing policy
|
Data from the Global Change Research Data Publishing & Repository includes metadata, datasets (data products), and publications (in this case, in the Journal of Global Change Data & Discovery). Data sharing policy includes: (1) Data are openly available and can be free downloaded via the Internet; (2) End users are encouraged to use Data subject to citation; (3) Users, who are by definition also value-added service providers, are welcome to redistribute Data subject to written permission from the GCdataPR Editorial Office and the issuance of a Data redistribution license; and (4) If Data are used to compile new datasets, the ‘ten percent principal’ should be followed, such that Data records utilized should not surpass 10% of the new dataset contents, while sources should be clearly noted in suitable places in the new dataset[6]
|
Table 2 Evaluation index system used to determine regional three-dimensional (3-D) development density
|
Index
|
Goals
|
Proxies used in the dataset
|
Data source
|
|
Development intensity
(I)
|
To reflect the size of the built-up area of the region, including indicators such as total area of built-up land and the proportional area of built-up land
|
The proportional area of built-up land
|
Interpretation from remote sensing, Landsat TM, and HJ-1A
|
|
Development compactness
(C)
|
To reflect the pattern of the built-up area, including indicators such as compactness, fragmentation, fractal dimension, and landscape separation index
|
The compactness index
|
Interpretation from remote sensing, Landsat TM, and HJ-1A
|
|
Development level
(D)
|
To reflect the regional development level of built-up land, including floor area ratio, building density, and economic density
|
Economic density
|
Simulation based on statistical NAGDP, DMSP/OLS nighttime light imagery, and remote sensing data
|
3.2 Technical Route
(1) Index calculation
Landsat Thematic Mapper (TM) images from 1998 and 2006 and HJ-1A images from 2012 were used to obtain the built-up area of the PRDM. Because Landsat TM stopped working in 2012, we used HJ-1A images produced by China after this date. Both image types have the same spatial resolution of 30 m. The night-time light imagery was derived from Version 4 of the DMSP-OLS Nighttime Lights Time Series, which was produced by the National Geophysical Data Center. We used night-time stable lights data because they are annual composites of all the available archived smooth resolution data for calendar years. The statistical NAGDP for each county were collected from the corresponding statistical yearbooks of Guangdong province and nine cities in the PRDM.
The first dimension was the development intensity indicator, which was expressed by the proportional area of built-up land within the total area of the region:
 (1)
(1)
where I is the regional development intensity, A is the area of built-up land, and S is the total area of the region.
The second dimension was the development compactness index. The dataset uses the classic algorithm proposed by Richardson and Gibbs in 1961[7] :
 (2)
(2)
where C is the regional development compactness, A is the total area of built-up land, and P is total perimeter of built-up land.
The third dimension was the development level, which was expressed as the economic density of the unit built-up land area:
D=GDPna/A (3)
where D is the regional development level, GDPna is non-agricultural GDP for the evaluation unit, and A is the total area of built-up land.
(2) Non-agricultural GDP spatialization process
The spatialization process consisted of five steps (Figure 1).
|
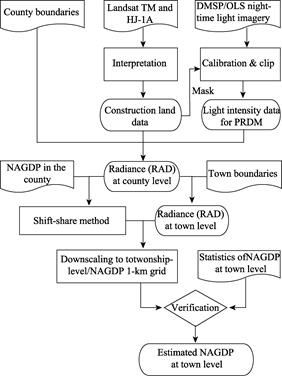
Figure 1 Development of non-agricultural GDP at town level
|
First, imagery based on the extent of the PRDM was extracted, and then the methods developed by Liu et al.[8] were applied, including inter-calibration, intra-annual composition, and inter-annual series correction, to correct the extracted images.
Second, the corrected nighttime lighting data were converted from raster to vector format, and the vector data based on the extent of built-up land was extracted. Then the area of the tailored vector data was calculated and the area was multiplied by the stable light value to obtain the light intensity value data.
Third, using the boundaries of counties and towns, the total light intensity value for each county and town was used as the night-time light radiance (RAD).
Fourth, the shift-share method (Figure 2) was used to allocate a county’s NAGDP level to each town in accordance with the proportion of RAD.
Fifth, the actual NAGDP was compared with the estimated value at the township level to validate the accuracy, and finally the simulated values of the township NAGDP in 1998, 2006, and 2012 were obtained. In the same way, the NAGDP at the kilometer grid scale was obtained.
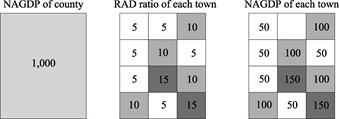
Figure 2 The shift-share method
4 Results and Validation
4.1 Data Composition
The dataset consists of three folders: geographic boundary data for the PRDM, 3-D regional development density at the township level, and non-agricultural GDP data at 1-km resolution.
(1) The folder of geographic boundary data for the PRDM includes data for the nine cities of the PRDM in .shp format. The nine cities are Guangzhou, Shenzhen, Zhuhai, Dongguan, Zhongshan, Foshan, Huizhou (excluding Longmen county), Jiangmen, and Zhaoqing (excluding the four counties of Guangning, Huaiji, Fengkai, and Deqing). The boundary data were obtained from the land use change survey data of Guangdong in 2006, which were updated according to the latest administrative division adjustments.
(2) The folder of three-dimensional regional development density of the PRMD at the township level in 1998, 2006, and 2012 contains three data files in .shp format: a) the development intensity of the PRMD, b) the development compactness of the PRMD, and c) the economic density of the PRMD.
(3) The folder of non-agricultural GDP data at 1-km resolution in 1998, 2006, and 2012 in .tif format.
The dataset interpretations were published in Tropical Geography, Volume 37, Issue 5[9].
4.2 Data Products
The geographical boundaries of the PRDM are based on the national counties’ boundary data at a scale of 1:10,000; therefore, the scale used for this dataset was also 1:10,000. The three .shp format data files for 3-D regional development density had a spatial resolution at the township level. The estimated NAGDP data were based on a 1 km × 1 km grid, and therefore had a spatial resolution of 1 km. The temporal resolution was 6 to 8 years.
4.3 Data Validation
One of the problems of night-time light imagery is the blooming effect. It results in an overestimation of the light area and radiance because the large pixel size from the OLS sensor is unable to resolve sub-pixel light sources[10]. The reflection of lighting near water surfaces also results in the spread of light and a blooming effect[11]. Compared to previous studies, using the extent of built-up area to obtain the radiance can minimize the blooming effect in light imagery. Hence, the RAD–NAGDP relationship derived in this study could lead to more robust results, and the more accurate estimated NAGDP.
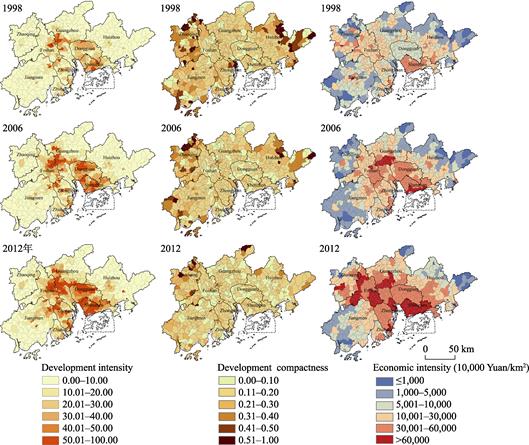
Figure 3 Three-dimensional (3-D) changes of the development density of the Pearl River Delta Megalopolis (PRDM) at the township scale during 1998–2012
Another problem with night-time light imagery is saturation. The OLS sensor cannot distinguish the differences between bright lights in the urban center (data values larger than 63). Therefore, nighttime imagery is limited in its ability to detect differences in economic development within highly developed urban areas (e.g., the downtown areas of Guangzhou), and therefore the estimated accuracy of township non-agricultural GDP data will be lower.
Based on the township level statistical NAGDP (79 samples), we calculated the R2 value and mean relative error (MRE) to score the accuracy of the estimation at the township level. The results of the validation indicated that the relative errors of more than 70% of the 79 samples were less than 40% and the MRE was 27.99%. As a result, we could use the spatialization results for further analysis. We also found that the 1-km NAGDP data could not be validated due to the lack of reliable data.
5 Discussion and Conclusion
Compared with the traditional method of development evaluation, this 3-D approach could synthetically and timeously reflect the regional development mode in multiple-dimensions using Landsat TM imagery and night-time light data. We applied this 3-D approach to the PRDM, and revealed the spatio-temporal dynamics of the development intensity, development compactness, and economic density, and the 1-km grid NAGDP. This approach enables a more comprehensive analysis of the essential characteristics and spatio-temporal pattern of the regional development mode, and will enable the optimization of land use planning and management of the megalopolis. In the future, through the use of big data and other advanced techniques, this approach and its accuracy could be further improved.
Author Contributions
Ye, Y. Y. designed the algorithms for the dataset. Li, S. F. contributed to the data processing and analysis and wrote the data paper.
References
[1] Schneider, A., Woodcock, C. Compact, dispersed, fragmented, extensive? A comparison of urban growth in twenty-five global cities using remotely sensed data, pattern metrics and census information [J]. Urban Studies, 2008, 45(3): 659–692.
[2] Schwarz, N. Urban form revisited-Selecting indicators for characterising European cities [J]. Landscape and Urban Planning, 2010, 96(1): 29–47.
[3] Hamidi, S., Ewing, R. A longitudinal study of changes in urban sprawl between 2000 and 2010 in the United States [J]. Landscape and Urban Planning, 2014, 128: 72–82.
[4] Jiang, F., Liu, S., Yuan, H. Measuring urban sprawl in Beijing with geospatial indices [J]. Acta Geographica Sinica, 2007, 62(6): 649–657.
[5] Li, S. F., Ye, Y. Y. Regional development density by three dimensions dataset in Pearl River Delta megalopolis (1998, 2006, 2012) [DB/OL]. Global Change Research Data Publishing & Repository, 2018. DOI: 10.3974/geodb.2018.06.17.V1.
[6] GCdataPR Editorial Office. GCdataPR data sharing policy [OL]. DOI: 10.3974/dp.policy.2014.05 (Updated 2017).
[7] Lin, B. The calculation method of urban spatial form and its evaluation [J]. Urban Planning Forum, 1998(3): 42–45.
[8] Liu, Z., He, C., Zhang, Q., et al. Extracting the dynamics of urban expansion in China using DMSP-OLS nighttime light data from 1992 to 2008 [J]. Landscape and Urban Planning, 2012, 106(1): 62–72.
[9] Ye, Y., Li, S., Zhang, H. et al. A three-dimensional approach to evaluate development density using multi- source remote sensing data: a case study of the Pearl River Delta megalopolis [J]. Tropical Geography, 2017, 37(1): 43–55.
[10] Doll, C. N. H., Muller, J. P., Morley, J. G. Mapping regional economic activity from night-time light satellite imagery [J]. Ecological Economics, 2006, 57: 75–92.
[11] Elvidge, C. D., Imhoff, M. L., Baugh, K. E., et al. Night-time lights of the world: 1994–1995 [J]. ISPRS Journal of Photogrammetry and Remote Sensing, 2001, 56: 81–99.